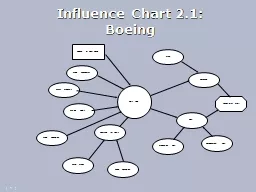
Longterm Profit Revenue Cost Price Production Cost Airline Economics Flying Population Units Sold Ticket Prices Demand for Seats Existing Fleets Airline Regulation Airbus Products Development Cost ID: 567853
Download Presentation The PPT/PDF document "Influence Chart 2.1: Boeing" is the property of its rightful owner. Permission is granted to download and print the materials on this web site for personal, non-commercial use only, and to display it on your personal computer provided you do not modify the materials and that you retain all copyright notices contained in the materials. By downloading content from our website, you accept the terms of this agreement.
Slide1
Influence Chart 2.1: Boeing
Long-term Profit
Revenue
Cost
Price
Production Cost
Airline Economics
Flying Population
Units Sold
Ticket Prices
Demand for Seats
Existing Fleets
Airline Regulation
Airbus Products
Development Cost
Choice of New PlaneSlide2
Influence Chart 2.2:
Red Cross Surplus
Fee
Surplus
Total Revenue
Total Cost
Price
Normal Cost
Normal Donors
Paid Donors
Normal Accepted
Paid Accepted
Potential Donors
Normal Rejection Rate
Paid Rejection Rate
Normal Donation Rate
Supply Elasticity
Paid Donation RateSlide3
Influence Chart 2.3: Alumni
DonationsAnnual
AlumniDonations
Donations by Class
Matching Gifts
GNP
Year since Graduation
Class Size
Reunion Year?
Inflation
Previous Year’s DonationsSlide4
Influence Chart 2.4: Amnesty
Illegal Population
Illegal Immigration
Citizenship
Risk Factors
Immigration
US Wages
Foreign Wages
Foreign Population
Amnesty?Slide5
Influence Chart 2.5: Voluntary
RecallFuture Stock Price
Hearing Product Sales
Sales of other Products
Demand
FDA Recall
Reported Hearing Loss
Public Reaction
Actual Hearing Loss
Voluntary Recall?