/
Orange juice in association to low-caloric diet contributes to weight-loss and glucose Orange juice in association to low-caloric diet contributes to weight-loss and glucose

Orange juice in association to low-caloric diet contributes to weight-loss and glucose - PowerPoint Presentation

aaron
aaron . @aaron
Follow
344 views
Uploaded On 2019-10-31

Orange juice in association to low-caloric diet contributes to weight-loss and glucose - PPT Presentation

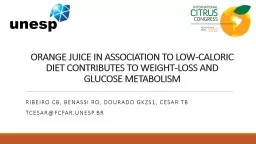
Orange juice in association to lowcaloric diet contributes to weightloss and glucose metabolism Carolina Ribeiro Renata Benassi Grace Dourado Thais Cesar Laboratory of Nutrition Food and Nutrition Department Pharmaceutical Sciences School ID: 761531

juice week orange body week juice body orange diet 2015 caloric composition weight control amp glucose weeks biomarkers blood

Share:

Link:

Embed:

Download Presentation from below link

Download Presentation The PPT/PDF document "Orange juice in association to low-calor..." is the property of its rightful owner. Permission is granted to download and print the materials on this web site for personal, non-commercial use only, and to display it on your personal computer provided you do not modify the materials and that you retain all copyright notices contained in the materials. By downloading content from our website, you accept the terms of this agreement.


Presentation Transcript

Orange juice in association to low-caloric diet contributes to weight-loss and glucose metabolism Carolina Ribeiro, Renata Benassi, Grace Dourado, Thais Cesar Laboratory of NutritionFood and Nutrition Department, Pharmaceutical Sciences School Sao Paulo State University- UNESP, Araraquara SP Brazil

Glucose intolerance High Cholesterol and TG Hypertension Systemic inflammation Stoner, L.,Cornwall, J, 2014. High adipose tissue stored in Obesity:Cluster of complications CVD, DiabetesPremature death2

reduce the diet energy density promote satiety decrease caloric intake Diets rich in fruits and vegetables, Contribute to weight control Regulate metabolic parametersGiugliano, et al, 2006; Tohill,2004. Fruits and their juices Nutrient-dense foods, providing vitamins, minerals, and bioactive compounds with relatively few calories plenty of water and fibers3

Emerging speculations: Do the fruit juices play a role in the obesity epidemic, contributing to weight-gain in children and adults? Beverages containing fruit juice X 100% fruit juices Nutritional composition: energy, sugars and bioactive compounds different effects on body composition?Rampersaud & Valim 2015; Dourado & Cesar 2015, Silveira, Dourado & Cesar, 2015 Shefferly 2016, Pan et al 2013, Hyson 2015,4

Recent evidences: daily consumption of OJ does not contribute: Adiposity or weight gain [ Dourado & Cesar, 2015]Insulin resistance and inflammation [Simpson & Macdonald, 2016, Silveira et al, 2015]Increasing cholesterol [Aptekmann & Cesar, 2015]Counteracting negative reports about the consumption of OJ. 5

Study proposal: Obese Subjects: men and women, apparently healthyEligibility criteria: 30 ≥ BMI ≤ 40 kg/m2Subjects assigned to two groups: “orange juice (OJ)” or “control” by a random-number generator program. Treatment:Low-caloric diet (LCD): Personal and balanced (DRI, 2006)Six meals/day (breakfast, morning snack, lunch, afternoon snack, dinner, supper)LCD + Orange juice: 250mL OJ morning snack + 250mL OJ afternoon snack 6

I nterventions 7 Trial design: A 12-week, parallel group, randomized (block size), controlled trial, conducted at the Pharmacy School, Sao Paulo State University, UNESP, Brazil.Body composition measurements were collected monthly.Blood samples and dietary questionnaires: collected every two weeks (Figure 1). Primary endpoint: Reduction of weight-loss by 5% between to initial and final body weightSecondary endpoint: modification of the levels of biomarkers related to obesityEthics Board of Pharmacy School, UNESP, approved the study (#1.241.033 ). All participants provided written informed consent.

8 This clinical study has been declared to the website ClinicalTrials.com under the # NCT02914249.

Screening September 8, 2015 Informed ConsentAnthropometric measurements Clinical HistoryDietetic History Volunteers (n=190)Week 0 Week 12 Baseline Body composition Blood collection Dietary prescription and recomemendations Assessment 3-d records Follow-up Supervision Body composition Blood collection Checking meals End of the study Body composition Blood collection Checking meals October 8, 2015 - Intervention Groups (n=88) 1) Control: Low caloric-diet (n=39 ) 2) Orange juice: Low caloric-diet + Orange Juice (n=39) Week 4 Week 8 Step 1 (4 weeks) Clinical Trial D esign # NCT02914249 . Step 2 (12 weeks) 9

10Body composition: standardized procedures (weight, hight , BMI, wait, etc)Bioelectrical impedance: InBody 720, Biospace, Tokyo, Japanfat mass (kg), lean mass (kg), and % body fat Biomarkers: TG, total cholesterol, HDL-C, glucose, AST, ALT, AKP, GT: commercial kits, Labtest , Brazilultrasensitive C-reactive protein (hsCRP): Dade Behring, USA HOMA-IR: cutoff was set at ≥2.71 [Matthews et al 1985]. Lipid peroxidation: TBARS assay [Yagi, K 1998] Total antioxidant capacity by radical ABTS •+ assay [Re et al 1999]. Diet: 3-day dietary records: Avanutri ® e TACO (UNICAMP) 100% Orange Juice: provided by a local producer (Citrosuco, Matao , SP) Chemical analysis : 0.7 % total titratable acidity, 15 ° Brix, 204 mg ascorbic acid, 34 mg phenolic compounds, 950 TEAC μmol antioxidant capacity, 240 kcal/500mL, 44 g total sugar, 162 mg hesperitin, and 7.7 mg naringenin [22] in two doses of OJ (500 mL).

RESULTS 11

Table 1. Baseline characteristics of the subjects Low-caloric diet Orange juice ControlSubjects(n = 39)(n = 39) (n = 78) Age, years37 ± 1 35 ± 1 36 ± 1 BMI, kg/m2 33 ± 3 34 ± 4 33 ± 3 Glucose, mg/dL 87 ± 7 85 ± 8 86 ± 7 Insulin, µU/mL 15 ± 6 15 ± 6 15 ± 6 HOMA-IR 3.2 ± 1.5 3.1 ± 1.3 3.1 ±1.4 Total cholesterol, mg/dL 185 ± 21 181 ± 31 183 ± 27 LDL-C, mg/dL 119 ± 27 115 ± 27 118 ± 27 HDL-C, mg/dL 44 ± 8 47 ± 11 45 ± 10 Non-HDLC, mg/dL 145 ± 27 133 ± 29 139 ± 28 Triglycerides, mg/dL 140 ± 40 141 ± 43 140 ± 41 hsCRP, mg/dL 0.5 ± 0.1 0.5 ± 0.1 0.5 ± 0.1 Alcaline phosphatase, U/L 73 ± 18 72 ± 16 73 ± 17 AST, U/L 21 ± 9 21 ± 7 21± 8 ALT, U/L 23 ± 8 20 ± 9 21 ±14  -GT, U/L 25 ± 7 24 ± 6 25 ± 7 12

Table 2. Body composition over the 12 weeks experiment 13 Low-caloric diet Orange juice (n = 39) Control (n = 39)0-wk 4-wk 8-wk 12-we  0-wk 4-wk 8-wk 12-wk Body comp.                   Body wt , kg 97 ± 12 a 94 ±12 b 92 ± 12 c 90 ± 11 d   98 ± 12 a 95 ±12 b 93 ± 12 c 92 ± 11 d BMI, kg/m 2 33 ± 3 a 32 ± 3 b 31 ± 3 c 31 ± 3 c   34 ± 4 a 33 ± 3 b 32 ± 3 c 31 ± 3 d Lean mass, kg 31 ± 6 a 30 ± 6 b 30 ± 6 b 30 ± 6 b   30 ± 5 a 29 ± 5 b 29 ± 5 b 29 ± 5 b Fat mass, kg 36 ± 10 a 34 ± 10 b 32 ± 10 c 31 ± 10 d   38 ± 10 a 36 ± 10 b 34 ± 10 c 33 ± 9 d Body fat, % 37 ± 9 a 36 ± 9 b 34 ± 9 c 34 ± 9 c   40 ± 8 a 39 ± 9 b 38 ± 9 c 37 ± 8 d Waist, cm 104 ± 10 a 100 ± 10 b 97± 10 c 96 ± 9 c   102 ± 10 a 98 ± 10 b 95 ± 10 c 93 ± 9 d Hip, cm 113 ± 9 a 110 ± 9 b 109 ± 10 c 108 ± 8 d   114 ± 9 a 113 ± 9 b 110 ± 8 c 109 ± 8 d waist/hip 1.0 ± 0.1 a 1.0 ±0.1 a 0.9 ± 0.1 b 0.9 ± 0.1 b   1.0 ± 0.1 a 1.0 ± 0.1 a 0.9 ± 0.1 b 0.9 ± 0.1 b

Table 3. M etabolic biomarkers in both groups (Orange Juice and Control) during 12-weeks. 14 Low-caloric dietOrange juice (n = 39) Control (n = 39) 0-week 4-week 8-week 12-week   0-week 4-week 8-week 12-week Biomarkers                   Glucose, mg/ dL 87 ± 10 a 83 ± 8 b 82 ± 7 bc 80 ± 7 c   85 ± 6 a 81 ± 6 b 81 ± 7 b 81 ± 6 b Insulin, µU/mL 15 ± 6 A,a 13 ± 5 A,b 11 ± 4 A,c 11 ± 4 A,c   15 ± 6 A,a 15 ± 7 A,a 14 ± 5 B,b 13 ± 6 B,c HOMA-IR 3.2 ± 1.5 A,a 2.8 ±1.2 A,b 2.2 ±0.8 A,c 2.1 ± 0.8 A,c   3.1 ± 1.3 A,a 3.1 ± 1.4 A,a 2.9 ± 1.4 B,b 2.7 ±1.1 B,c TC, mg/ dL 185 ±21 A,a 173 ±21 A,b 170 ±28 A,c 155 ±20 A,d   181 ± 30 A,a 172 ± 30 A,b 171 ± 28 A,b 165 ± 28 B,c LDL-C, mg/dL 119 ±27 A,a 111 ±24 A,b 107 ±26 A,b 85 ± 18 A,c   115 ± 27 A,a 109 ± 23 A,b 108 ±26 A,b 105 ±27 B,b HDL-C, mg/ dL 44 ± 8 a 42 ± 8 b 43 ± 9 a,b 44 ± 10 a   47 ± 11 a 44 ± 10 b 44 ± 10 b 44 ± 10 b Non-HDL 144 ± 27 a 135 ± 24 b 130 ± 25 c 115 ± 24 d   133 ± 30 a 130 ± 30 b 127 ± 29 c 121 ± 27 d TG, mg/ dL 140 ± 40 a 127 ± 41 b 117 ± 40 c 109 ± 34 d   141 ± 43 a 133 ± 40 b 119 ± 40 c 112 ± 38 c hsCRP, mg/dL 0.5± 0.1 A,a 0.4± 0.1 A,b 0.4 ±0.1 A,b 0.3± 0.1 A,c   0.5± 0.1 A,a 0.5 ± 0.1 A,a 0.4± 0.1 A,b 0.4±0.1 B,b Alcaline Phosp . 73 ± 18 a 71 ± 15 b 70 ± 16 b 68 ± 18 c   72 ± 18 a 69 ± 16 b 68 ± 15 b 67 ± 15 b AST, U/L 21 ± 9 a 21 ± 6 a 19 ± 5 b 18 ± 5 b   21 ±7 a 20 ± 6 a,b 19 ± 6 b 19 ± 6 b ALT, U/L 22 ± 8 a 22 ± 8 a 19 ± 8 b 19 ± 9 b   20 ± 9 a 23 ± 10 b 21 ± 9 a,c 20 ± 7 a,c  GT, U/L 25 ± 7 a 22 ± 9 b 22 ± 9 b 21 ± 8 c   24 ± 6 a 23 ± 7 b 23 ± 8 b 23 ± 8 b TAC, mM 1.8 ±0.03 a 1.8 ±0.04 a 1.9 ±0.04 b 1.9 ± 0.04 b   1.8 ±0.08 a 1.8 ± 0.08 a 1.8 ± 0.05 a 1.8 ±0.04 a [MDA ] mM 1.5 ±0.9 a 1.2 ± 0.6 b 1.2 ± 0.6 b 0.8 ± 0.4 c   1.7 ± 0.8 a 1.5 ± 0.7 b 1.5 ± 0.7 b 0.9 ±0.5 c

15 Time schedule 0-week 4-week 8-week 12-week Control (n = 39) Adiponectin (ug/mL) 18 ± 6.B,a 20b ± 7 B,b 20 ± 7 B,b 21 ± 7 B,b Leptin (ng/mL) 31 ± 9 a 29 ± 8 a 27 ± 9 b 27 ± 9 b IL-6 ( pg /mL 6.1 ± 1.8 a 4.9 ± 1.7 b 4.1 ± 1.7 c 3.1 ± 1.6 d TNF- α ( pg /mL) 7.5 ±2.4 a 6.7 ± 1.7 b 6.5 ±1.7 b 5.7 ±1.7 c Orange juice (n = 39) Adiponectin ( ug /mL) 19 ± 5 A,a 18 ± 5 A,b 15 ± 5.3 A,c 15 ± 5 A,c Leptin (ng/mL) 31 ± 14 a 29 ± 13 b 27 ± 12 c 27 ± 12cIL-6 (pg/mL6.0 ± 2.6a5.5 ± 2.6 b 4.6 ± 1.6 c 3.3 ± 2.0 d TNF- α ( pg /mL)7.6 ±2.7a7.4 ±2.1a6.7 ± 2.0b5.9 ±1.8c Table 4. Inflammatory biomarkers in both groups (Orange Juice and Control) during 12-weeks.

Conclusion: Improved the nutritional quality of the diet (  Vit C and  Folate); Improved biochemical ( LDL-C) and metabolic biomarkers ( IR and CRP), without increasing blood glucose; OJ worked together with low-calorie diet for a sustained weight lossOJ combined with low caloric-diet: +16

Thank you Moderate consumption of OJ provides nutritional and dietary benefits with no adverse impact on body weight, while improves metabolic parameters in obese people17