/
58%  of exchange enrollees 58%  of exchange enrollees

58% of exchange enrollees - PowerPoint Presentation

accompanypepsi
accompanypepsi . @accompanypepsi
Follow
343 views
Uploaded On 2020-08-05

58% of exchange enrollees - PPT Presentation

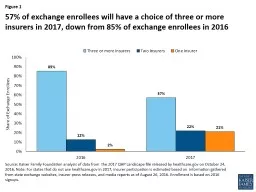
have a choice of three or more insurers in 2017 down from 85 of exchange enrollees in 2016 Source Kaiser Family Foundation analysis of data from the 2017 QHP Landscape file released by healthcaregov on October 24 2016 ID: 799449

2017 2016 exchange insurer 2016 2017 insurer exchange gov healthcare based states participation foundation family kaiser press websites state

Share:

Link:

Embed:

Download Presentation from below link

Download The PPT/PDF document "58% of exchange enrollees" is the property of its rightful owner. Permission is granted to download and print the materials on this web site for personal, non-commercial use only, and to display it on your personal computer provided you do not modify the materials and that you retain all copyright notices contained in the materials. By downloading content from our website, you accept the terms of this agreement.


Presentation Transcript

Slide1

58% of exchange enrollees have a choice of three or more insurers in 2017, down from 85% of exchange enrollees in 2016

Source: Kaiser Family Foundation analysis of data from the 2017 QHP Landscape file released by healthcare.gov on October 24, 2016.

Note

: For states that do not use healthcare.gov in 2017, insurer participation is estimated based on information gathered from state exchange websites, insurer press releases, and media reports as of August 26, 2016. Enrollment is based on 2016 signups.

Slide2

1,021 counties have only one exchange insurer in 2017 compared to 225 counties in 2016

Source: Kaiser Family Foundation analysis of data from the 2017 QHP Landscape file released by healthcare.gov on October 24, 2016.

Note

: For states that do not use healthcare.gov in 2017, insurer participation is estimated based on information gathered from state exchange websites, insurer press releases, and media reports as of August 26, 2016. Enrollment is based on 2016 signups.

Slide3

Source: Kaiser Family Foundation analysis of data from the 2017 QHP Landscape file released by healthcare.gov on October 24, 2016. Note: For states that do not use healthcare.gov in 2017, insurer participation is estimated based on information gathered from state exchange websites, insurer press releases, and media reports as of August 26, 2016. Enrollment is based on 2016 signups.

Metro/Non-Metro county classifications are based on definitions from the Federal Office of Rural Health Policy.

62% of exchange enrollees living in

m

etro counties will have a choice of three or more insurers in 2017

Slide4

Source: Kaiser Family Foundation analysis of

data from the 2017 QHP Landscape file released by healthcare.gov on October 24, 2016. Note: For states that do not use healthcare.gov in 2017, insurer participation is estimated based on information gathered from state exchange websites, insurer press releases, and media reports as of August 26, 2016. Enrollment

is based on 2016 signups.

Distribution of Exchange

Enrollees

by Number of

Insurers in

2016 and

2017

Slide5

Source: Kaiser Family Foundation analysis of data from the 2017 QHP Landscape file released by healthcare.gov on October 24, 2016. Note: For states that do not use healthcare.gov in 2017, insurer participation is estimated based on information gathered from state exchange websites, insurer press releases, and media reports as of August 26, 2016. Enrollment is based on 2016 signups.

32% of counties will have one exchange insurer in 2017, compared to 7% of counties with one exchange insurer in 2016

Slide6

Source: Kaiser Family Foundation analysis of data from  the 2017 QHP Landscape file released by healthcare.gov on October 24, 2016. Note: We define the number of insurers in a single county as the number of insurers (grouped by parent company or group affiliation) that offer at least one silver plan in the

county. For states that do not use healthcare.gov in 2017, insurer participation is estimated based on  information gathered from state exchange websites, insurer press releases, and media reports as of August 26, 2016. States that do not use healthcare.gov in 2017 are: California, Colorado, Connecticut, District of Columbia, Idaho, Maryland, Massachusetts, Minnesota, New York, Rhode Island, Vermont, and Washington. See the interactive map here:

https://public.tableau.com/profile/kaiser.family.foundation#!/

vizhome/InsurerParticipationinthe2017IndividualMarketplace/2017InsurerParticipation

Insurer Participation by County in 2017