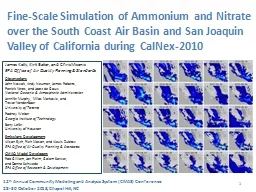
EPA Office of Air Quality Planning amp Standards Observations John Nowak Andy Neuman James Roberts Patrick Veres and Joost de Gouw National Oceanic amp Atmospheric Administration Jennifer Murphy Milos Markovic and ID: 786286
Download The PPT/PDF document "James Kelly, Kirk Baker, and Chris Misen..." is the property of its rightful owner. Permission is granted to download and print the materials on this web site for personal, non-commercial use only, and to display it on your personal computer provided you do not modify the materials and that you retain all copyright notices contained in the materials. By downloading content from our website, you accept the terms of this agreement.
Slide1
James Kelly, Kirk Baker, and Chris MisenisEPA Office of Air Quality Planning & StandardsObservationsJohn Nowak, Andy Neuman, James Roberts, Patrick Veres, and Joost de GouwNational Oceanic & Atmospheric AdministrationJennifer Murphy, Milos Markovic, and Trevor VandenBoerUniversity of TorontoRodney WeberGeorgia Institute of TechnologyBarry LeferUniversity of HoustonEmissions DevelopmentAlison Eyth, Rich Mason, and Alexis ZubrowEPA Office of Air Quality Planning & StandardsCMAQ Model DevelopersRob Gilliam, Jon Pleim, Golam Sarwar, and Donna SchwedeEPA Office of Research & Development
Fine-Scale Simulation of Ammonium and Nitrate over the South Coast Air Basin and San Joaquin Valley of California during CalNex-2010
12th Annual Community Modeling and Analysis System (CMAS) Conference 28-30 October 2013, Chapel Hill, NC
1
Slide2PM2.5 in South Coast and SJVPrimary PM2.5 NAAQS levels are set to protect human healthAnnual NAAQS Level: 12 mg m-324-h NAAQS Level: 35 mg m-32010-2012 PM2.5 Design Values exceed NAAQS levels in SC & SJV NH4+ and NO3- make up >50% of PM2.5 mass on polluted days2
AreaHighest Annual
Highest 24-hSouth Coast15.6
37
San
Joaquin Valley
19
59
Sources:
http://www.epa.gov/airtrends/values.html http://www.aqmd.gov/aqmp/2012aqmp/Final-February2013/AppII.pdf http://www.valleyair.org/Air_Quality_Plans/PM25Plans2012.htm
Slide3MotivationAccurate NH4+ and NO3- modeling is useful for developing control plans, health and exposure studies, and single-source applicationsModeling NH4+ and NO3- is challenging in California due to complex emissions, terrain, meteorology, and chemistry, e.g.,CalNex-2010 provides a rich dataset for model evaluation3Figure: Nowak et al. (2012) Ammonia sources in the California South Coast Air Basin and their impact on ammonium nitrate formation, Geophys. Res. LettersNowak et al. (2012)
Emissions: ports, LA, dairy facilities
Terrain: San Gabriel, San Bernardino, and San Jacinto Mtns.Meteorology: land-sea breeze, upslope-downslope
flow, Temp. inversions, Bight recirculation
Chemistry
:
aging of LA and port emissions and mixing w/ dairy
emiss
.
Slide44Model ConfigurationCategoryDescriptionSimulation period4 May – 30 June 2010AQ modelCMAQv5.0.1Resolution4-km horizontal, 34 vertical layersGas-Phase chemistryCB05TUAerosol chemistryAERO6MeteorologyWRFv3.4 with ACM2 PBL and PX LSMBoundary conditionsGEOS-Chem v8-03-02Onroad/nonroad emissionsInterpolated from CARB’s 2007 and 2011 totalsPoint source emissions2010 dataOther US anthro. emissions2008 NEIv2
Biogenic emissionsBEISv3.14, offline, w/ BELD3 land-use data (USGS)
Slide5Precursor Gases: NH3 and HNO35NH3 is directly emittedLivestock and agricultureAutomobilesWaste disposalHNO3 forms via NOx oxidation in atmosphereDaytime: NO + O3 → NO2NO2 + OH → HNO3Nighttime:NO + O3 → NO2NO2 + O3 → NO3(g)NO2 + NO
3(g) ↔ N2O5
N2O5+ H2O(p) → 2HNO3
Photos:
Castillo (2009)
California Agriculture
63(3):149-151.
Bishop et al. (2012) Environ.
Sci & Technol. 46(1):551-558
Slide6Gas-Particle PartitioningTotal NHx (NH3+NH4+) and total nitrate (HNO3+NO3-) partition between the gas phase and fine particles according to equilibrium6HNO3(g) ↔ H+(p) + NO3-(p)NH3(g) + H+(p) ↔ NH4+(p)
Inorganic Fine Aerosol Equilibrium
Ca
2+
Mg
2+
K
+
NO
3-NH4+
SO4
2-
Na
+
HNO
3
NH
3
H
2
SO
4
Cl
-
HCl
H
+
H
+
H
+
OH
-
CO
3
2-
H
2
O
Slide77Nitrate Evaluation with CSN DataGood correlation in Bakersfield and RiversideUnder-prediction of high values in RiversideOver-prediction on May 26th in Los Angeles4-km domain and CSN SitesLs_Ang-NMain (Los Angeles)Rvrside-Rubi (Riverside-Rubidoux)Baker-5558Ca (Bakersfield)Fresno-1st (Fresno)
Slide88Daily Average Nitrate w/ CSN DataCSN SitesL: Ls_Ang-NmainR: Rvrside-RubiB: Baker-5558CaF: Fresno-1st
Slide99NH3 from NOAA WP-3Peak* NH3 ConcentrationPeak§ NH3 Emissions§NH3 Emissions > 0.66 tons day-1*NH3 Concentration > 150 ppb
Photo: J. Nowak, NOAA/CIRES
In South Coast, the location of peak concentrations and emissions agrees reasonably well
In SJV, spatial allocation of emissions warrants further investigation
Slide1010NH3 on 8 and 19 May 2010 Under-predictions downwind of Chino dairy facilities, e.g., (1) and (4)Over-predictions along San Gabriel Mountains near Pasadena, e.g., (3)Note: NH3 emissions are quite variable from dairy facilities and aircraft transects provide only short snapshots of concentration
Slide1111HNO3 on 8 and 19 May 2010 Over-predictions downwind of Chino dairy facilities, e.g., (1) and (4)Under-predictions along San Gabriel Mountains near Pasadena, e.g., (3)Note: aircraft transects provide only short snapshots of concentration
Slide1212NO3- peaks are out of phaseGas-phase fraction Too high during dayToo low during night Nitrate System at Pasadena
Google
Slide1313PBL collapses too early in the evening on 24 May 2010 and leads to NH3 and NO over-predictionNO over-prediction leads to excessive titration of O3 and production of HNO3 via N2O5 Total nitrate partitions too much to the particle phase during night causing nighttime NO3- peakTiming of NO3- Peak on 24-25 May
Slide1414Gas Fraction of Nitrate (GFN) at PasadenaISORROPIA II calculations of GFN constrained by average modeled values (left) and observed values (right)During morning and night, GFN gradients based on modeled and observed conditions are similar but total ammonia is over-predicted (top and bottom)During the day, ISORROPIA II predicts higher GFN for average modeled conditions than for average observed conditions (middle)Gas Fraction of Nitrate (GFN): HNO3 / (HNO3 + NO3-)
Slide1515Modeled ConditionsModel w/Observed Na+Model w/Observed Na+ & RHObserved ConditionsDaytime GFN Sensitivity at PasadenaDaytime gas fraction of nitrate is sensitive to Na+ and RH
Under-predictions of Na+ and, to a lesser degree, RH could explain daytime over-predictions of GFN
Slide16Conclusion16Good correlation for predictions and observations of 24-h NO3- at key CSN sites suggests basic processes are capturedOver-predictions of NH3 in Pasadena and under-predictions near Riverside appear to influence gas-particle partitioning of total nitrateMeteorology also influences gas-particle partitioning, and early PBL collapse can lead to NO3- over-predictions at nightDuring the daytime, under-predictions of Na+ concentration may cause too much partitioning of total nitrate to gas phaseFuture work will focus on model development for meteorology, emissions, and chemistry to improve simulations of NH4+ and NO3-