/
Development of 3-D Geological Model of Tuscarora Sandstone for Feasibility of Deep Direct-Use Development of 3-D Geological Model of Tuscarora Sandstone for Feasibility of Deep Direct-Use

Development of 3-D Geological Model of Tuscarora Sandstone for Feasibility of Deep Direct-Use - PowerPoint Presentation

adia
adia . @adia
Follow
66 views
Uploaded On 2023-09-20

Development of 3-D Geological Model of Tuscarora Sandstone for Feasibility of Deep Direct-Use - PPT Presentation

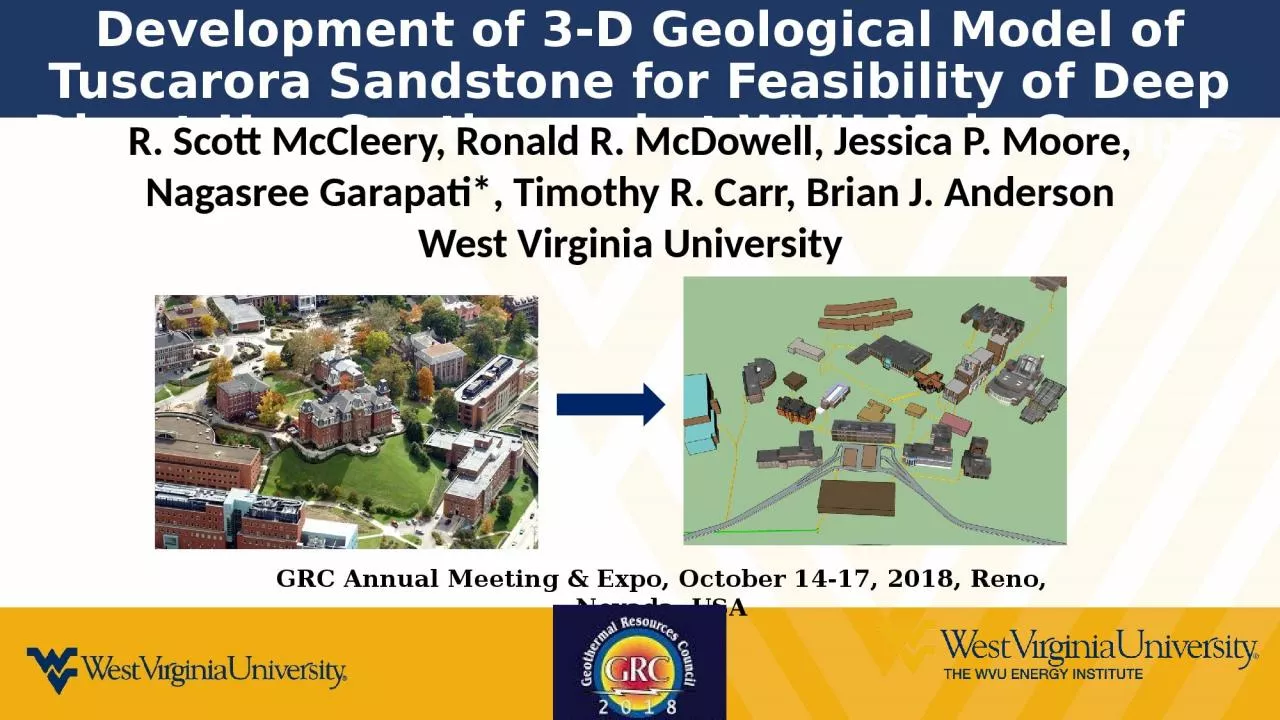
R Scott McCleery Ronald R McDowell Jessica P Moore Nagasree Garapati Timothy R Carr Brian J Anderson West Virginia University GRC Annual Meeting amp Expo October 1417 2018 Reno Nevada USA ID: 1018529

tuscarora geothermal core permeability geothermal tuscarora permeability core wells fracture geological system structural model depth section proposed direct analysis

Share:

Link:

Embed:

Download Presentation from below link

Download Presentation The PPT/PDF document "Development of 3-D Geological Model of T..." is the property of its rightful owner. Permission is granted to download and print the materials on this web site for personal, non-commercial use only, and to display it on your personal computer provided you do not modify the materials and that you retain all copyright notices contained in the materials. By downloading content from our website, you accept the terms of this agreement.


Presentation Transcript

1. Development of 3-D Geological Model of Tuscarora Sandstone for Feasibility of Deep Direct-Use Geothermal at WVU Main CampusR. Scott McCleery, Ronald R. McDowell, Jessica P. Moore, Nagasree Garapati*, Timothy R. Carr, Brian J. AndersonWest Virginia UniversityGRC Annual Meeting & Expo, October 14-17, 2018, Reno, Nevada, USA

2. BackgroundReservoir Parameter Estimation3-D Geological Model Outline

3. BackgroundReservoir Parameter Estimation3-D Geological Model Outline

4. 4Design of a Geothermal District Heating and Cooling (GDHC) system providing heat to the WVU campus and replacing the current coal-fired system.Year-round utilization of the DDU system, significantly lowering the annually levelized cost of heat, thus providing the first demonstration in the eastern U.S. of the practical feasibility and effectiveness of geothermal technologies and systems.Start DateOctober2017Fall 2019Spring2020Spring 2021Summer 2022Summer 2023Summer 2025September 2026March 2027TaskFeasibility Project StartExploratory Well PlanningExploratory Well Drilling and EvaluationInjection Well Drilling and Formation EvaluationProduction Well Drilling and Flow TestingDistribution System UpgradingBuilding IntegrationCommission-ingNew System StartWVU GDHC System Development TimelineDeep Direct Use Geothermal

5. The impact of this project on advancing the state-of-the-art in geothermal deep direct-use is three-fold:We will design the subsurface geothermal system incorporating the current state-of-the-art in unconventional hydrocarbon development.The development of our GDHC system on the Morgantown, WVU campus will be the first geothermal DDU heating and cooling system in the eastern U.S., demonstrating that geothermal is a national resource not limited to the western states.The project will perform a fully-integrated assessment and optimization of the potential to incorporate DDU into an existing district heating system. 5Impact of Technology Advancement

6. 6Project ObjectivesPrimary Goals:Minimization of uncertainty and risk associated with developing the geothermal resource on campusMinimizing the delivered levelized cost of heat (LCOH) by designing optimized geothermal systemThe target location of the WVU campus in Morgantown, West Virginia, affords an optimal and unique combination of critical factors necessary to develop deep direct use geothermal.

7. The elevated temperatures and high flow conductivity makes the proposed site an ideal geothermal resource for direct use. The thermal resource has been informed by an ongoing project (MSEEL) led by WVU.The extrapolated temperature of the Tuscarora at 10,000 ft is approximately 100°C.Based on the resistivity logs and gas production histories in the Tuscarora, significant well deliverability is expected. 7Thermal resource and site suitabilityWVGES geologic cross section D-D’ near Morgantown, WV illustrating the expected depth of the target formation.

8. BackgroundReservoir Parameter Estimation3-D Geological Model Outline

9. Cores are analyzed by performing core analysis using thin section analysis and computed tomography (CT) scanning. Direct permeability measurements are taken on selected core segments from the entire length of the core, using the PPP-250 Minipermeameter.In addition to permeability, fracture lengths, widths, and orientation angle with respect to core vertical and horizontal are measured.Geothermal gradient is estimated, using bottom hole temperature information from the wells penetrating the Tuscarora.9Reservoir Parameter EstimationLocation of cores in relation to WVU’s Evansdale campus. Circles surrounding core locations denote a 40-mile radius.

10. 10Core Analysis- Thin Section analysisTuscarora Visual Porosity-Clay 513 Well. Twenty-eight samples from the Clay-513 core are selected for thin-section analysis.Point counts and/or visual estimation of porosity, grain size, sorting, rounding, maturity, gross mineralogy, and cement type are noted.Average porosity ~ 3% Heterogeneous, localized porosity contrasts:Small fracturesstylolites, Burrow-fills

11. 11Core Analysis- Thin Section analysisThin-section photomicrograph from the Clay-513 coreSample A; 7436 ft. [2266.5 m]: Heavy minerals are concentrated along a stylolite. Sample Y; 7490 ft. [2283 m]): Irregular burrow backfilled with very fine quartz sand.

12. 12Core Analysis- Computed Tomography ScansThe scanning was performed with a medical Toshiba Aquilon TSX-101 A/R medical scanner. Resultant images have a millimeter-scale resolution (0.43 x 0.43 mm in the XY plane; 0.50 mm along core axis). Changes in the CT number obtained from the scans are visualized as grayscale values; light regions in the scan are more dense, and dark regions less dense. The complete set of CT scans were then annotated in CorelDRAW to identify potential fracture networks.CT scan images of selected intervals from Preston 119.

13. 13Permeability MeasurementsDirect permeability measurements are taken on selected core segments from the entire length of the core.Core segments are selected based primarily on the presence of visible fractures. Fracture lengths, widths, and orientation with respect to core vertical and horizontal are also measured.Matrix permeability for each segment is also measured. Measurements are made using the PPP-250 Minipermeameter

14. 14Permeability MeasurementsPermeability measurements from Preston 119. Measurements for 753 unique locations on 279 different core samples spanning a 273 ft (83 m) thickness.Klinkenberg permeability correction is used to estimate effective water permeabilityPermeable zones greater than 1 D are found throughout the Tuscarora thickness. The shallower portion of the Tuscarora seems to have more frequent permeable zones than the deeper portion.

15. 15Permeability MeasurementsSome of the notable features and permeability targets encountered in the Preston 119 coreOpen vertical fracture – depth 7203’Microfault– depth 7405.75’ Oblique, sand-filled burrow – depth 7372’vertical stylolite with an open fracture- depth 7199.0’horizontal stylolite with an open fracture -depth 7234.0’large, open vug lined with a coating of euhedral quartz crystals -depth 7192.0’

16. 16Permeability MeasurementsStacked barplot showing the contribution to the observed permeability by the type of structural feature measured. Permeability measurements were taken on several structural features that are known to affect permeability.Permeabilities less than 10 mD are found primarily in the matrix rock.Average matrix permeability is 2.67 mD.Fracture permeability dominates, average fracture permeability is 164 mDPreston-119 well is located near the highly fractured Eglon Anticline.Therefore, the fracture permeability will be considered as an upper bound estimate of Tuscarora fracture permeability.

17. 17Temperature AnalysisGeothermal gradients (GTG) have been calculated for wells penetrating the Tuscarora, around the DDU study area, derived from bottom hole temperature information. Map showing the location of the 5 closest Tuscarora penetrations.

18. 18Temperature AnalysisTemperature data and GTG plot for the Clifford J May #A-1, 47061003070000, in Monongalia, Co. Temperature data calculated for the Tuscarora formation in the 5 closest wells to the DDU study area. Clifford J May #A-1, located in Monongalia, Co.

19. 19ConclusionsThe proposed geothermal site is characterized based on the geological information available from the cores and well logs for nearby existing wells.The Tuscarora Sandstone is identified as a very fine- to very coarse-grained, poorly- to well-sorted, quartzose sandstone.Porosity appears to be generally low but what is present is often localized along small fractures. The presence of relatively large, open voids suggests that some of the tectonic fractures may have been open, even at reservoir depth.Geothermal gradient is estimated to be in the range of 1.22 -1.59°F/100 ft (~22-29°C/km)

20. BackgroundReservoir Parameter Estimation3-D Geological Model Outline

21. To develop the 3D geological model, structural surfaces were constructed from subsurface well picks. 213-D Geological ModelMap showing location of wells drilled around Morgantown, WV with available geophysical logs. Aspects creating difficulty in developing a structural model for the Tuscarora, in the area of the proposed geothermal well:there are only 12 wells that have well logs in the 10 mi2 (26 km2) area surrounding the proposed geothermal wellsite,most of the closest wells penetrate only the shallowest correlation top, only five wells in a 15 mi2 (39 km2) area around the proposed geothermal wellsite penetrate the target, Tuscarora Sandstone,only three wells in the area penetrate the base of the Tuscarora.

22. 223-D Geological ModelView of the 3D model, looking northeast. Four of the six surfaces are shown. From shallowest to deepest: LNG, TLLY (Tully Ls.), ORSK (Oriskany Ss.), and TUSC (Tuscarora Ss.).The 2D-3D surface modeling was performed in GES modeling software, a product of GPT Reservoir Characterization Professionals*.Conformable gridding methodology was employed to developing a meaningful structural interpretation for the Tuscarora. Apart from the shallowest surface, the five deeper surfaces were gridded using the trend of the surface above it, as a control. *www.gptsoft.com

23. 233-D Geological Model2D structure map of the target Tuscarora Sandstone.Cross section through four wellsThe cross section displays a gently southeast dipping Tuscarora surface, into a syncline separating the proposed geothermal site from the South Burns Chapel Field (a NE-SW trending anticline).NS

24. 24ConclusionsA 3-D structural surface is generated by correlating thirty wells surrounding the proposed geothermal wellsite.The final structural interpretation of the Tuscarora is reasonable, in the context of regional structural trends, it lacks the data density to precisely constrain the structure under the site of the geothermal project.Due to the lack of subsurface data available for this study, the results of the structural modeling have a significant amount of uncertainty.The plan forward is to integrate available 2D seismic data to reduce the uncertainty of the subsurface model.

25. 25AcknowledgementsThank YouDE-EE0008105