/
Symptomatic Illnesses Medical Visits Symptomatic Illnesses Medical Visits

Symptomatic Illnesses Medical Visits - PowerPoint Presentation

adia
adia . @adia
Follow
346 views
Uploaded On 2022-06-07

Symptomatic Illnesses Medical Visits - PPT Presentation

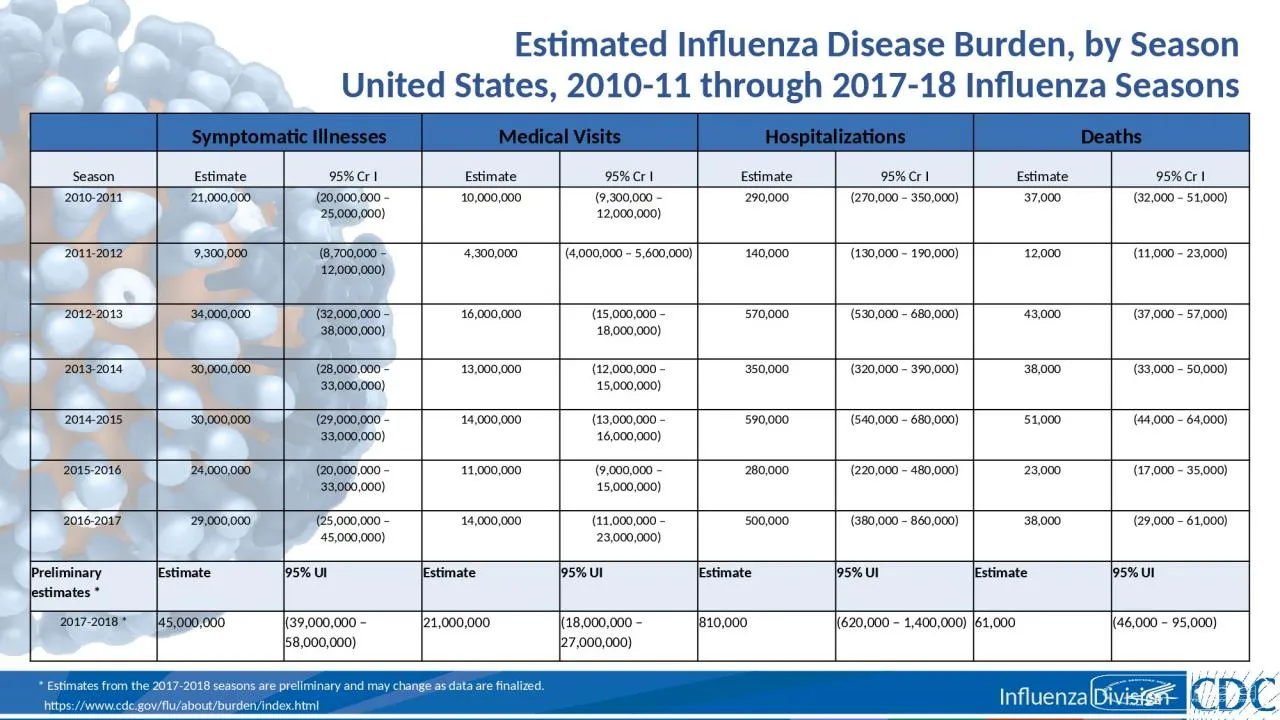
Hospitalizations Deaths Season Estimate 95 Cr I Estimate 95 Cr I Estimate 95 Cr I Estimate 95 Cr I 20102011 21000000 20000000 25000000 10000000 9300000 12000000 ID: 913770

burden 000 states influenza 000 burden influenza states 2017 flu 2010 cdc index iestimate95 300 estimates gov www html

Share:

Link:

Embed:

Download Presentation from below link

Download Presentation The PPT/PDF document "Symptomatic Illnesses Medical Visits" is the property of its rightful owner. Permission is granted to download and print the materials on this web site for personal, non-commercial use only, and to display it on your personal computer provided you do not modify the materials and that you retain all copyright notices contained in the materials. By downloading content from our website, you accept the terms of this agreement.


Presentation Transcript

Slide1

Symptomatic IllnessesMedical VisitsHospitalizationsDeathsSeasonEstimate95% Cr IEstimate95% Cr IEstimate95% Cr IEstimate95% Cr I2010-201121,000,000(20,000,000 – 25,000,000)10,000,000(9,300,000 – 12,000,000)290,000(270,000 – 350,000)37,000(32,000 – 51,000)2011-20129,300,000(8,700,000 – 12,000,000)4,300,000(4,000,000 – 5,600,000)140,000(130,000 – 190,000)12,000(11,000 – 23,000)2012-201334,000,000(32,000,000 – 38,000,000)16,000,000(15,000,000 – 18,000,000)570,000(530,000 – 680,000)43,000(37,000 – 57,000)2013-201430,000,000(28,000,000 – 33,000,000)13,000,000(12,000,000 – 15,000,000)350,000(320,000 – 390,000)38,000(33,000 – 50,000)2014-201530,000,000(29,000,000 – 33,000,000)14,000,000(13,000,000 – 16,000,000)590,000(540,000 – 680,000)51,000(44,000 – 64,000)2015-2016 24,000,000(20,000,000 – 33,000,000)11,000,000(9,000,000 – 15,000,000)280,000(220,000 – 480,000)23,000(17,000 – 35,000)2016-2017 29,000,000(25,000,000 – 45,000,000)14,000,000(11,000,000 – 23,000,000)500,000(380,000 – 860,000)38,000(29,000 – 61,000)Preliminary estimates *Estimate95% UIEstimate95% UIEstimate95% UIEstimate95% UI2017-2018 *45,000,000(39,000,000 – 58,000,000)21,000,000(18,000,000 – 27,000,000)810,000(620,000 – 1,400,000)61,000(46,000 – 95,000)

Estimated Influenza Disease Burden, by SeasonUnited States, 2010-11 through 2017-18 Influenza Seasons

* Estimates from the 2017-2018 seasons are preliminary and may change as data are finalized.

https://www.cdc.gov/flu/about/burden/index.html

Slide2

Estimated Influenza Disease Burden, by SeasonUnited States, 2010-11 through 2017-18 Influenza Seasonshttps://www.cdc.gov/flu/about/burden/index.html

Slide3

Estimated Range of Annual Burden of FluUnited States, 2010-11 through 2017-18 Influenza SeasonsThe burden of influenza disease in the United States can vary widely and is determined by a number of factors including the characteristics of circulating viruses, the timing of the season, how well the vaccine is working to protect against illness, and how many people got vaccinated. While the impact of flu varies, it places a substantial burden on the health of people in the United States each year.CDC estimates that influenza has resulted in between 9 million – 45 million illnesses, between 140,000 – 810,000 hospitalizations and between 12,000 – 61,000 deaths annually since 2010.https://www.cdc.gov/flu/about/burden/index.html