/
5.2 Energy transfer between 5.2 Energy transfer between

5.2 Energy transfer between - PowerPoint Presentation

alexa-scheidler
alexa-scheidler . @alexa-scheidler
Follow
417 views
Uploaded On 2016-07-30

5.2 Energy transfer between - PPT Presentation

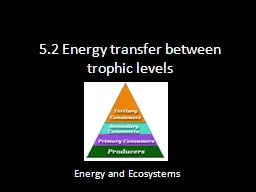
trophic levels Energy and Ecosystems Learning Objectives All students should be able to calculate The percentage of energy transferred from one trophic level to the next Percentage efficiency of energy transfers ID: 425218

trophic energy year transfer energy trophic transfer year levels percentage food consumers lost plants production chain give transferred level

Share:

Link:

Embed:

Download Presentation from below link

Download Presentation The PPT/PDF document "5.2 Energy transfer between" is the property of its rightful owner. Permission is granted to download and print the materials on this web site for personal, non-commercial use only, and to display it on your personal computer provided you do not modify the materials and that you retain all copyright notices contained in the materials. By downloading content from our website, you accept the terms of this agreement.


Presentation Transcript

Slide1

5.2 Energy transfer between trophic levels

Energy and Ecosystems Slide2

Learning ObjectivesAll students should be able to calculate:

The percentage of energy transferred from one trophic level to the next.

Percentage efficiency of energy transfers .

All students should know:

How energy is lost along a food chain.

Why most food chains have no more than five

trophic

levelsSlide3

Success Criteria

I can name the source of all energy for ecosystems.I can give the percentage of light energy captured by green plants which is made available to organisms in the food chain.

I can give 4 reasons for why most of the Sun’s energy is

NOT

converted to organic matter by photosynthesis.

I can use the equation:

Net production = Gross production – Respiratory losses

I can calculate the percentage efficiency of energy transfers.

I can give 4 reasons why there is a low percentage of energy transferred at each

trophic

level.Slide4

Energy transfer between trophic levels

What is the source of all energy for ecosystems?

What percentage of light energy is captured by green plants and is made available to organisms in the food chain?

1%Slide5

Energy losses in food chains

Plants convert 1% - 3% of the Sun’s energy into organic matter (carbohydrates, proteins, lipids etc). Can you give 4 reasons for why most of the Sun’s energy is NOT

converted to organic matter by photosynthesis?

Over 90% of the Sun’s energy is

reflected back into space

by clouds and dust or

absorbed by the atmosphere.

Not all

wavelengths

of light can be absorbed and used for photosynthesis.

Light may not fall on a chlorophyll

moleculeA limiting factor, such as low carbon dioxide levels, may limit the rate of photosynthesis.Slide6

You need to know this equation:

Gross production

: The total quantity of energy that the plants in a community convert to organic matter.

Respiratory losses

: Plants use 20% to 50% of the gross production energy for

respiration

, leaving little to be stored.

Net production

: The rate at which the plant stores energy.

Net production = Gross production – Respiratory lossesSlide7

Consumers only pass a small fraction of the energy that they receive to each successive stage in the chain.

Primary consumers use 10% of food stored in plants for growth.Secondary and tertiary consumers transfer 20% of the energy from their prey into their own bodies (more efficient).

Question: Give 4 reasons why there is a low percentage of energy transferred at each stage:

Part of the organism is not eaten.

Some parts are eaten but cannot be digested and are lost in faeces.

Some energy is lost in excretory materials e.g. urine.

Some energy losses occur as heat from respiration (directly from the body to the environment). These losses are high in mammals and birds because of their high body temperature. Much energy is needed to maintain their body temperature when heat is being constantly lost to the environment.Slide8

Energy transfer between trophic levels is relatively inefficient.

This has the following consequences:Food chains tend to have

4/5

trophic

levels because insufficient energy is available to support a large enough breeding population at

trophic

levels higher than these.

The total mass of organisms in a particular place (

biomass

) is less at higher

trophic levels.The total amount of

energy stored is less at each level as one moves up a food chain.Slide9

Primary consumers

Secondary consumers

Tertiary consumers

Decomposers and

detritivores

(feeding on faeces, urine and dead organisms)

Producers

Energy lost as heat during respiration

Energy lost as reflected light etc

Sun

1-3%

5-10%

15-20%

15-20%

Energy flow through different

trophic

levels of a food chain. Arrows (not to scale) give an idea of the proportion of energy transferred at each stage. The figures for % energy transfers between

trophic

levels are only a rough average as they vary considerably between different plants, animals and habitats.Slide10

Calculating the efficiency of energy transfersThe energy available at each

trophic level is usually measured in kilojoules per square metre per year (kJm-2

year

-1

).

energy available after the transfer

energy available before the transfer

X 100

Efficiency =Slide11

Plenary: Answer the following questions!

Today we will self assess our answers. Please ensure that you show all working out and all units for calculation questions. Please correct all wrong answers. Slide12

Question1: Food chain in Cayuga Lake, New York State.

Calculate the percentage efficiency of the transfer of energy between:

Primary consumers and secondary consumers

Tertiary consumers and quaternary consumers

Producers and

quarternary

consumers

(6 marks)

Algae

42000 kJ m

-2

year

-1

Small aquatic animals

6 300 kJ m

-2

year

-1

Smelt

1250 kJ m

-2

year

-1

Trout

250 kJ m

-2

year

-1

Human

50 kJ m

-2

year

-1

Producers

Primary

consumers

Secondaryconsumers

Tertiaryconsumers

QuaternaryconsumersSlide13

Energy available after the transfer (i.e. Available to smelt) = 1250 kJ m-2

year-1 Energy available before the transfer (i.e. Available to small aquatic animal) = 6 300 kJ m

-2

year

-1

Percentage = (1250 ÷ 6300) x 100 = 19.84%

b) Energy available after the transfer (i.e. Available to humans) = 50kJ m

-2

year

-1

Energy available before the transfer (i.e. Available to trout) = 250kJ m

-2

year-1 Percentage = (50 ÷ 250) x 100 = 20%c) Energy available after the transfer (i.e. Available to humans) = 50kJ m

-2

year

-1

Energy available before the transfer (i.e. Available to algae) = 42000kJ m

-2

year

-1

Percentage = (50 ÷ 42000) x 100 = 0.12%Slide14

Question 2: State 3 reasons for the small percentage of energy transferred at each trophic level (3 marks).

Some of the organism is not eaten (1)

Some parts are not digested and so are lost as faeces (1)

Some energy is lost as excretory materials (1)

Some energy is lost as heat (1)Slide15

Question 4: Explain why most food chains rarely have more than four trophic levels (2 marks).

The proportion of energy transferred at each

trophic

level is small (less than 20%). (1)

After four

trophic

levels there is insufficient energy to support a large enough breeding population. (1)