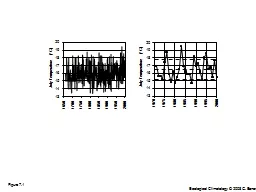
CO 2 CH 4 SO 2 PM25 SO 4 Observed Changes in Greenhouse Gases Maryland Healthy Air Act and Observed Changes in Air Quality Konstantin K Vinnikov amp Russell R Dickerson AOSCUMD ID: 467158
Download Presentation The PPT/PDF document "CHEMICAL CLIMATOLOGY STUDIES" is the property of its rightful owner. Permission is granted to download and print the materials on this web site for personal, non-commercial use only, and to display it on your personal computer provided you do not modify the materials and that you retain all copyright notices contained in the materials. By downloading content from our website, you accept the terms of this agreement.
Slide1
CHEMICAL CLIMATOLOGY STUDIES:CO2, CH4, SO2, PM2.5, SO4, …
Observed Changes in Greenhouse GasesMaryland Healthy Air Act and Observed Changes in Air Quality
Konstantin K. Vinnikov & Russell R. Dickerson (AOSC/UMD),Nickolay A. Krotkov (GSFC/NASA) , ...
MDE/UMD Quarterly Meeting, November 12, 2013Slide2
1995-2012 TREND19.46 ppm/10yr
19.31 ppm/10yr19.68 ppm
/10yr19.57 ppm/10yr
19.07
ppm
/10yr
19.12
ppm
/10yr
18.78
ppm
/10yr
2Slide3
SOUTH POLE, ANTARCTICA.89.98oS, 24.80oW, 2810m
Data are considered “BACKGROUND”.Data provided by:Kirk Thoning, Earth System Research Laboratory, NOAA
1995-2012 TREND=18.78 ppm/10yr
3Slide4
THESE USA CO
2 HOURLY RECORDS ARE OBTAINED FROM EPA AQS DATA ARCHIVE4Slide5
MEAN TREND1995-201214.06 ppm/10yr
5Slide6
GLOBAL MONITORING OF CH4 BY NOAA: HOURLY RECORDS
6Slide7
THESE ARE FIVE THE LONGEST HOURLY METHANE RECORDS IN EPA DATA ARCHIVE. ONLY THREE OF THEM ARE VALID. ALL OTHER RECORDS ARE VERY SHORT.
7Slide8
8Slide9
Conclusion:NOAA monitors global changes of main greenhouse gases. Concentrations of Carbon Dioxide and Methane near land surface display strong diurnal and seasonal cycles. Monitoring of these gases organized by NOAA is not sufficient to control regional sources and sinks of these gases.
9Slide10
MARYLAND, HOURLY TIME SERIES OF SO
2 EMISSION10Slide11
TREND COMPONENTS OF ENERGY GENERATED AND SO
2 EMITTED11Slide12
CHANGE OF SURFACE SO
2 IN RESPONSE TO HEALTHY AIR ACT.TIME SERIES OF HOURLY SO2 CONCENTRATION OBSERVED AT MD/DC AQS
Observed AQS data display noticeable decrease of SO2 concentrations after 2010. Let us compare seasonal/ diurnal patterns of SO2
for two periods 2006-2008 and 2010-2012, before and after Healthy Air Act
X-time.
12Slide13
SEASONAL/DIURNAL VARIATIONS SO2
OBSERVED AT THREE MD AQS BEFORE (2006-08) AND AFTER (2010-12) MARYLAND HEALTHY AIR ACT X-TIMEAre these changes really caused by the Healthy Air Act? Are they caused by change power plants SO2 emissions in MD?
13Slide14
SATELLITE (OMI) OBSERVED DECREASE OF COLUMN MEAN SO
2 CONTENT AT MARYLAND BEFORE AND AFTER 2010 14Slide15
LAG-CORRELATION FUNCTIONS OF RANDOM COMPONENT IN TEMPORAL VARIATIONS SO
2 CONCENTRATIONS AND DECAY TIMES OF SO2 ANOMALIES
R(τ) - is empirical estimate of Lag-correlation function for different Lags,
τ
.
R(
τ
) ≈ exp(-|
τ
|/T
o
) - is approximation of Lag-correlation function.
To – Decay Time - is estimated from least square condition:
Σ(
ln(R(τ
))-|τ|/T
o)
2=min.
To – Estimated Decay Time (or - Life Time of temporal perturbations, or – Scale of temporal variability) for our variables is equal to about
few hours.
15Slide16
16Slide17
Seasonal-Diurnal Cycles of PM2.5 Particles (
μg
/m3
) during 2010-2012
Estimates of R(
τ
) - Lag-Correlation Functions of PM2.5
η
– fraction of white noise
Τ
- Lag
T
- Decay time, or Scale
MEAN,
μg
/m
3
STD,
μg
/m
3
White Noise, %
QNTL(95%) μg/m
3
QNTL(99%) μg/m
3
QNTL(99.9%) μg/m
3
SCALE
T,
hour
Rockville
11.1
6.7
15
25
34
46
19
Beltsville
11.9
8.0
29*
25
34
48
13*
Oldtown
12.8
7.6
12
27
37
53
18
Fairhill
10.9
7.1
8
26
35
46
18
Hagerstown
11.7
7.6
14
27
37
50
20
* means pure approximation
17Slide18
Diurnal Cycle in PM2.5 is weak and can be neglected.
Decay Time of PM2.5 anomalies is 18-20 hr which is ~4 times larger compared to SO
2. This means that changes in PM2.5 can be partly imported to MD from neighboring States.
Five MD and one DC stations display significant systematic decrease observed PM2.5 concentration in 2010-12 compared to 2006-08. This decrease is the largest during the warm months of a year.
18Slide19
Decrease of SULFATE (SO4
) in atmospheric aerosol PM2.5 observed in MDFrostburg, MD and Washington, DC stations monitor content of Sulfate in aerosol particles smaller than 2.5 μm.Beltsville, MD and
Blackwater NWR, MD observed total amount of Sulfate in atmospheric aerosol particles using Teflon and Nylon filters. We see analogous decrease of Sulfate concentration from 2006-08 to 2010-12 in data of both pairs of these stations.
19Slide20
TEMPORAL VARIATION OF MD SURFACE OBSERVED OPTICAL DEPTH tau500
AERONET Project Observed decrease of Atmospheric Optical Depth tau500 in Maryland from 2006-8 to 2010-12 is consistent with observed decrease of surface concentration of PM2.5 particles.
20Slide21
tttCONCLUSIONS:
By comparing mean values of variables for 2006-08 (before MD HAA) and for 2010-12 (three year after MD HAA) we found the following:
Significant decrease of MD Power Plants SO2 Emission agreement w CEMs.
Tremendous decrease of SO
2
concentration observed at MD
AQS
stations.
Small
decrease in surface concentration of PM2.5 particles in MD.
Consistent Decrease of Optical Depth of Atmospheric Air tau500.
We estimated Decay Time of anomalies of observed variables and found:
1. Decay Time of fluctuations of Electric Energy Generated and SO
2
emitted by all Power Plants of MD together is in range 2-3 days.
Decay Time of SO
2 anomalies at surface stations is much smaller and is in range 2-8 hours depending on season and daytime.
Decay Time of anomalies of PM2.5 aerosol particles is 18-20 hours.
Very short Life Time of SO
2
in atmosphere permit us to attribute the most of the “tremendous decrease of SO
2
concentration observed in MD” after 2010 to the Healthy Air Act.
Longer Life Time of atmospheric aerosols means that the observed decrease in PM2.5, Sulfate, and Atmospheric Optical Depth in MD can be PARTLY imported from the neighboring States.
Available but limited Medical Statistical reports show simultaneous decrease of Asthma Hospitalization and Cardiovascular mortality in MD and neighboring States. Health effects of MD Healthy Air Act still should be assessed.
21