/
NOHRSC  OPERATIONS  AND THE SIMULATION OF SNOW COVER PROPERTIES FOR THE COTERMINOUS US NOHRSC  OPERATIONS  AND THE SIMULATION OF SNOW COVER PROPERTIES FOR THE COTERMINOUS US

NOHRSC OPERATIONS AND THE SIMULATION OF SNOW COVER PROPERTIES FOR THE COTERMINOUS US - PDF document

alexa-scheidler
alexa-scheidler . @alexa-scheidler
Follow
425 views
Uploaded On 2017-03-29

NOHRSC OPERATIONS AND THE SIMULATION OF SNOW COVER PROPERTIES FOR THE COTERMINOUS US - PPT Presentation

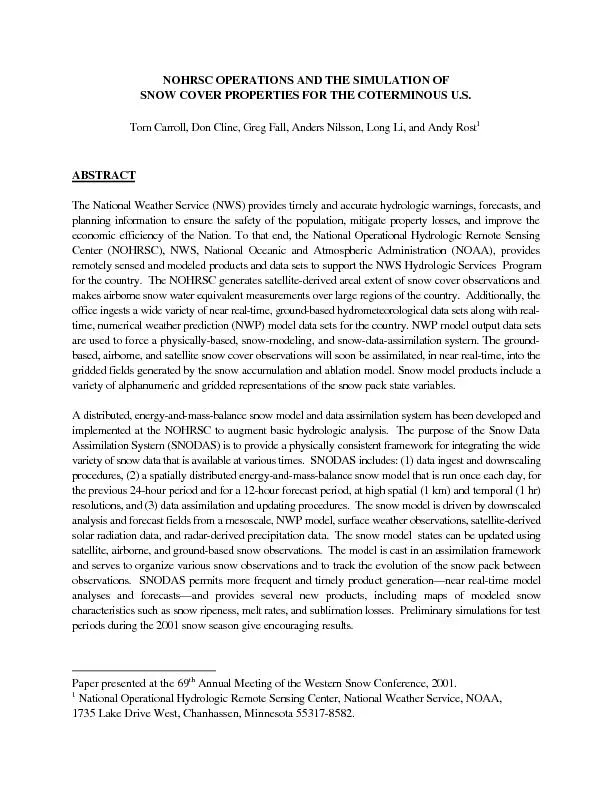
The National Weather Service NWS provides timely and accurate hydrologic warnings forecasts andplanning information to ensure the safety of the population mitigate property losses and improve th ID: 332280

The National Weather Service (NWS)

Share:

Link:

Embed:

Download Presentation from below link

Download Pdf The PPT/PDF document "NOHRSC OPERATIONS AND THE SIMULATION O..." is the property of its rightful owner. Permission is granted to download and print the materials on this web site for personal, non-commercial use only, and to display it on your personal computer provided you do not modify the materials and that you retain all copyright notices contained in the materials. By downloading content from our website, you accept the terms of this agreement.


Presentation Transcript

NOHRSC OPERATIONS AND THE SIMULATION OFSNOW COVER PROPERTIES FOR THE COTERMINOUS U.S.Tom Carroll, Don Cline, Greg Fall, Anders Nilsson, Long Li, and Andy Rost1 ABSTRACT The National Weather Service (NWS) provides timely and accurate hydrologic warnings, forecasts, andplanning information to ensure the safety of the population, mitigate property losses, and improve theeconomic efficiency of the Nation. To that end, the National Operational Hydrologic Remote SensingCenter (NOHRSC), NWS, National Oceanic and Atmospheric Administration (NOAA), providesremotely sensed and modeled products and data sets to support the NWS Hydrologic Services Programfor the country. The NOHRSC generates satellite-derived areal extent of snow cover observations andmakes airborne snow water equivalent measurements over large regions of the country. Additionally, theoffice ingests a wide variety of near real-time, ground-based hydrometeorological data sets along with real-time, numerical weather prediction (NWP) model data sets for the country. NWP model output data setsare used to force a physically-based, snow-modeling, and snow-data-assimilation system. The ground-based, airborne, and satellite snow cover observations will soon be assimilated, in near real-time, into thegridded fields generated by the snow accumulation and ablation model. Snow model products include avariety of alphanumeric and gridded representations of the snow pack state variables.A distributed, energy-and-mass-balance snow model and data assimilation system has been developed andimplemented at the NOHRSC to augment basic hydrologic analysis. The purpose of the Snow DataAssimilation System (SNODAS) is to provide a physically consistent framework for integrating the widevariety of snow data that is available at various times. SNODAS includes: (1) data ingest and downscalingprocedures, (2) a spatially distributed energy-and-mass-balance snow model that is run once each day, forthe previous 24-hour period and for a 12-hour forecast period, at high spatial (1 km) and temporal (1 hr)resolutions, and (3) data assimilation and updating procedures. The snow model is driven by downscaledanalysis and forecast fields from a mesoscale, NWP model, surface weather observations, satellite-derivedsolar radiation data, and radar-derived precipitation data. The snow model states can be updated usingsatellite, airborne, and ground-based snow observations. The model is cast in an assimilation frameworkand serves to organize various snow observations and to track the evolution of the snow pack betweenobservations. SNODAS permits more frequent and timely product generation—near real-time modelanalyses and forecasts—and provides several new products, including maps of modeled snowcharacteristics such as snow ripeness, melt rates, and sublimation losses. Preliminary simulations for testperiods during the 2001 snow season give encouraging results. Paper presented at the 69th Annual Meeting of the Western Snow Conference, 2001.1 National Operational Hydrologic Remote Sensing Center, National Weather Service, NOAA,1735 Lake Drive West, Chanhassen, Minnesota 55317-8582. 2 The National Operational Hydrologic Remote Sensing Center (NOHRSC), National Weather Service(NWS), National Oceanic and Atmospheric Administration (NOAA), generates satellite-derived arealextent of snow cover observations and makes airborne snow water equivalent measurements over largeregions of the country. Additionally, the NOHRSC ingests a wide variety of real-time, ground-basedhydrometeorological data sets along with real-time, numerical weather prediction (NWP) model data setsfor the country. These data sets are used at the NOHRSC to generate near real-time operational products,in raster and alphanumeric format, of snow water equivalent, satellite-derived areal extent of snow cover,surface temperature, and cumulative freezing and thawing degree days for the country. The NOHRSCproducts are used by the NWS River Forecast Centers (RFC) in their mission to issue river and floodforecasts, water supply forecasts in the West, and spring snow-melt flood forecasts for the country to savelives and property. Additionally, the NOHRSC products are used by other Federal, state, and localagencies and by the private sector to support a variety of operational and research hydrology programs.The Problem Unfortunately, the available ground-based, airborne, and satellite snow cover data sets are not sufficient tosatisfy the NWS RFC hydrologic modeling and forecasting requirements for the country. There are simplynot enough snow observations to provide hydrologic forecasters with a near real-time, reliable, highresolution (1 km), gridded snow water equivalent product for the country required to support NWSoperational hydrologic forecasting. Never has been; probably never will be. Consequently, a promisingsolution to the problem is to capitalize on the more widely available, near real-time, meteorologicalobservations and NWP model output to model snow water equivalent and other snow pack properties.Observed snow water equivalent, snow depth, and satellite-derived areal extent of snow cover data can,in turn, be used to update the appropriate snow model states when the data are available. In this way, itis possible to use all of the available data, (i.e., NWP model output coupled with meteorological and snowobservations) to generate a “best estimate” of gridded snow water equivalent for the country in near real-time.NOHRSC Current Operations The NOHRSC satellite remote sensing program focuses on NOAA GOES and AVHRR data. Data ingestand pre-processing steps are performed automatically, including data calibration and orbital navigation,image alignment with surface features, solar normalization of visible data, and cloud detection (Carroll, et., 2000). Manual image analysis is used to classify snow cover from image data. The image processingenvironment incorporates a variety of geospatial data sets to facilitate the image classification process. Theprincipal product is a daily map of areal extent of snow and cloud cover for the continental U.S. 3Additionally, the NOHRSC maintains an Airborne Gamma Radiation Snow Survey Program to make nearreal-time snow water equivalent measurements over a network of 1,900 flight lines covering portions of 29states and 7 Canadian provinces (Carroll, 1985). The ability to make reliable airborne gamma radiationsnow water equivalent measurements is based on the fact that natural terrestrial gamma radiation is emittedfrom the potassium, uranium, and thorium radioisotopes in the upper 20 cm of soil. The radiation is sensedfrom a low-flying aircraft flying 150 m above the ground. Water mass in the snow cover attenuates, orblocks, the terrestrial radiation signal. Consequently, the difference between terrestrial radiationmeasurements made over bare ground and over snow-covered ground can be used to estimate a meanareal snow water equivalent over the approximately 2-3 km2 flight line with a root mean square error of lessthan one cm.Satellite-derived snow- and cloud-cover products are used in conjunction with airborne and ground-basedobservations of snow water equivalent to perform analyses of the spatial distribution of snow waterequivalent. Daily maps of snow water equivalent are generated using available ground-based and airbornesnow water equivalent data sets. Additionally, regional snow water equivalent maps for the central andeastern U.S. are produced following each NOHRSC airborne snow survey mission. Alphanumericsummaries of these maps are provided, in near real-time, to operational hydrologic forecasters in NWS fieldoffices to support river, flood, and water supply forecasting.Lastly, the NOHRSC routinely generates daily surface temperature, cumulative freezing and thawingdegree-day, and snow depth (from cooperative observer data) products for the coterminous U.S. Temporal composites of satellite-derived areal extent of snow cover and cooperative observer snow depthproducts are generated each week.NOHRSC DATA INGEST, DATA PROCESSING, AND OPERATIONAL PRODUCT GENERATION The NOHRSC ingests a large amount of data each day to generate the operational snow cover productsdescribed above. Included are ground-based and airborne snow water equivalent and snow depth data andsatellite data used to derive areal extent of snow cover products. Because the available snow waterequivalent data are not sufficient to generate reliable snow water equivalent estimates at sufficient resolution(1 km), the NOHRSC ingests mesoscale, NWP model data sets that are used to drive the physically-basedsnow model (Figure 1).NOHRSC Satellite and Hydrometeorological Data Ingest A variety of data sets are ingested daily at the NOHRSC and include ground-based snow water equivalentand snow depth data from the Natural Resources Conservation Service (NRCS), the California Departmentof Water Resources, BC Ministry of Environment, U.S. Army Corps of Engineers, NWS cooperativeobservers, and other sources. Each day, the office ingests, processes, and archives all snow data availablefrom about half of the 11,000 NWS cooperative observers, from 1,100 automated snow water equivalent 4sensors, from 1,600 snow courses, and from about 800 snow-spotters across the U.S. and Canada. Approximately 1,000 to 1,500 airborne snow water equivalent measurements are made each snow seasonand ingested by the NOHRSC. Additionally, the office ingests the full spectral and spatial resolution GOESEast and West satellite data four times each hour. Six passes of AVHRR data are ingested daily by theNOHRSC NOAA Polar Orbiting earth receive station. The GOES and AVHRR satellite data sets (andeventually, MODIS) are used to infer areal extent of snow cover over the coterminous U.S. The AVHRRdata are used also to map areal extent of snow cover in Alaska each spring. NWP hourly model data (i.e.,Rapid Update Cycle 2) and NEXRAD-derived precipitation estimates for the coterminous U.S. areingested daily and used to drive the physically-based snow model.National Operational HydrologicRemote Sensing Center Operations Ground Data METAR, SNOTELCADWRNWS Co- Snow SurveyProgram Satellite Data GOES, AVHRRSSM/I, MODIS Numerical Weather Model Data Eta, RUC2 NEXRADRadar Data Operational Product Processing System Snow Cover Snow Water Equivalent Air Temperature Soil MoistureMaps and Summaries NOHRSCWeb Site Direct FileTransfer Data InputData ProcessingData & ProductsProduct Distribution Geospatial Relational Database Analysis/Data Processing SoftwareFigure 1. Ground-based, airborne, satellite, numerical weather prediction (NWP) model,and radar data for the country are ingested daily at the NOHRSC. The input data areprocessed and archived by the Operational Products Processing System (OPPS). OPPSgenerates a variety of products in map and alphanumeric format that are distributed innear real-time to NWS and non-NWS users.Product Generation and Data Processing: the Operational Products Processing System Data processing and product generation is accomplished by a software suite referred to as the NOHRSCOperational Products Processing System (OPPS) (Hartman, et al., 1995). OPPS was designed anddeveloped in-house to meet the following design objectives: 5 To streamline, to the greatest extent possible, the production ofsnow estimation products in an operational environment,2. To integrate, in an automated and objective manner, a wide varietyof input data sources used to produce snow estimation products,3. To develop and employ state-of-the-art spatial data processingalgorithms tailored to the task of producing snow estimationproducts from integrated input data sources, and4. To automate the dissemination of generated products.OPPS is designed to automate data integration. Primarily through the use of spatial interpolation techniquesand polygon membership modeling, OPPS is capable of integrating raster data with point, line, and arealvector data. The integration of variable-resolution raster data is supported by run-time data sub- and super-sampling functions allowing OPPS to define a range of output product resolutions without regard to theresolution of the input data.The spatial integration of raster and vector data is supported by automated procedures that exploit thetemporal distribution of the input data. Many OPPS processes are designed to evaluate data withinwindows of opportunity centered on a target date and time. Because OPPS is designed to address snowestimation on a continental scale, there is a strong possibility that suitable input data are not available for agiven instant in time. For example, processes that require satellite-derived areal extent of snow cover mapsare often hampered by cloud cover. By integrating the cloud-free portions of multiple snow cover mapsacquired during a window of opportunity, OPPS can minimize the impact that cloud cover has on the snowestimation process. Similar mechanisms were designed into OPPS for the treatment of each input datasource.OPPS consists of a series synchronized programs communicating with one another through an Informixdatabase server and system calls. The OPPS programs fall into three classes: Database, Analysis, andProduct Development. The OPPS programs are supported by the OPPS database consisting of static anddynamic tabular and graphic data. The dynamic portion of the OPPS database is constantly updated by awide variety of inputs. OPPS is designed to integrate data from a variety of sources, data-types, structuresand formats. OPPS can handle both raster and vector data types. Raster data can be variable in resolution.Vector data may be either point, line, or area structures.To minimize distortions associated with map-projected coordinates, OPPS requires that all of its inputs bein geodetic (longitude and latitude or Earth) coordinate pairs. All calculations are performed in the geodeticcoordinate system. The World Geodetic System 1984 (WGS 84) horizontal datum and the NationalGeodetic Vertical Datum of 1929 (NGVD 29) were selected for OPPS on the basis of the availability ofdigital elevation model (DEM) data. Many of the analysis programs in OPPS model orographic processesand, as such, are highly dependent upon DEM data. The highest quality of DEM Data available in nationalcoverage are in the WGS 84 and NGVD 29 datums. The system is designed to ingest raster data inGRASS, ARC/INFO, and Global Imaging formats. It can be easily modified to ingest raster dataconforming to the Spatial Data Transfer Standard raster profile upon significant demand. 6Point observation data are registered and stored as Informix database records. OPPS is capable ofingesting flat files into the Informix database. All line and areal vector structures are stored in OPPS as1. Produce a single raster mosaic of a larger area from multiple2. Produce a single raster composite from temporally-distributedrasters occupying the same geographic area. As rasters areBoth functions can operate simultaneously and there is full control of how multiple rasters are integrated.OPPS Product Generation and Distribution OPPS is designed to generate final map products at four different scales: NWS County Warning Area scale(112 in the coterminous U.S.), RFC scale (12 in the coterminous U.S.), East/West scale, and the full U.S.of each map product are automatically generated anddistributed in Standard Hydrologic Exchange Format (SHEF). The SHEF messages give airborne snowof the map element for each RFC hydrologic forecast basin. The maps and SHEF products are distributed, in near real-time, over the NWS Advanced Weather Interactivewww.nohrsc.noaa.go) (Figure 1). NOHRSC SNOW DATA ASSIMILATION SYSTEM The SNODAS Snow Model Because snow water equivalent observations are not sufficient in time or space across the coterminous U.S. 7 SNODAS consists, essentially, of three components: (1) data ingest, quality control, and downscalingprocedures, (2) a snow accumulation and ablation model, and (3) snow model data assimilation andupdating procedures. Hydrometeorological observations and NWP output are used to force the snowmodel, run at 1 km resolution, for the country (Figure 2). Furthermore, after the model is initialized,periodic (or sometimes daily) observations of snow water equivalent, snow depth, and areal extent of snowcover will be assimilated into the modeled snow states at the appropriate time step. This paper focuses onthe development, implementation, and preliminary results of a real-time, energy-and-mass-balance snowmodel for the coterminous U.S.NOHRSC SNODAS Snow Model NOHRSC Relative HumidityWind SpeedSolar RadiationAtmos. RadiationPrecipitationPrecipitation Type NWP Hourly InputGridded Data (1 km) SoilsLand Use/CoverSilvics Static GriddedData (1 km) EnergyBalance Snow Model Blowing Snow Model Radiative Transfer Model -Liquid Water Content-Grain Size-Mass Transport State Variables for Multiple Vertical Snow & Soil Layers OPPSGeospatial Database Product Generation NWS Field Offices Data InputSnow ModelProducts/ArchiveFigure 2. The NOHRSC SNODAS snow model uses hourly NWP model output productsand static data sets as input. The model includes an energy-and-mass-balance snowmodel, a blowing snow model, and a radiative transfer model. Model output is sent toOPPS and used in NOHRSC snow mapping and product generation.The model is an energy-and-mass-balance, spatially-uncoupled, vertically-distributed, multi-layer snowmodel. The model incorporates the mathematical approach of Tarboton and Luce (1996) to address thesnow surface temperature solution and that of Jordan (1990) to address the snow thermal dynamics forenergy and mass fluxes as represented in SNTHERM.89. It accounts for the net mass transport from thesnow surface to the atmosphere by sublimation of the saltation-transported and suspension-transportedsnow as developed by Pomeroy, et al. (1993). 8The model is forced by hourly, 1 km, gridded, meteorological input data downscaled from mesoscale NWPmodel (RUC2) analyses with the three major-layer state variables of water content, internal energy, andthickness. It generates total snow water equivalent, snow pack thickness, and energy content of the packalong with a number of energy and mass fluxes at the snow surface and between the snow and soil layers.Development of the snow model was motivated by the need for moderate spatial resolution (~1 km)commensurate with operational, optical, remote sensing data sets (i.e., GOES and AVHRR) used to updatethe model. Additionally, high temporal resolution (hourly) is required to provide adequate representationof the physical processes in shallow packs. These spatial and temporal resolution requirements for thecoterminous U.S. demand computational efficiency by the model. The current multi-layer snow model ismoderately comprehensive with a strong physical bases. It requires only a few input state variables, isparsimonious and efficient in computation, and is appropriate for representing most prevailing snow packconditions.Snow Model Data Input SNODAS is driven with gridded estimates of air temperature, relative humidity, wind speed, precipitation,incident solar radiation, and incident longwave radiation (Figure 3). Surface meteorological data areacquired by the NOHRSC from manual and automatic weather stations. Most of these data are in METARformat and are decoded, quality controlled, and inserted into the NOHRSC Informix database. Additionalsurface meteorological data are acquired from sources such as the NRCS snow pillow sites and from NWScooperative observers. The meteorological driving data for the SNODAS snow model are generated bydownscaling gridded NWP model analysis products from the Rapid Update Cycle (RUC2) developed andsupported by the NOAA Forecast Systems Laboratory (FSL) in Boulder, Colorado (Miller and Benjamin,1992). If, for some reason, the RUC2 data are temporarily unavailable, the system is capable of ingestingautomatically the companion FSL Mesoscale Analysis and Prediction System (MAPS) data sets. TheNational Environmental Satellite, Data, and Information Service, NOAA, currently produces solar radiationproducts derived from the GOES imager and sounder data (Tarpley, et al., 1997) that are used by thesnow model (Figure 3).SNODAS also uses “static” gridded data such as digital elevation data and associated derivatives of slopeand aspect, forest cover and forest type information derived from remotely sensed data, and soilsinformation (Figure 3). Numerical weather model data (scaled and unscaled) used to drive the snow modelare also used with satellite observations to automatically detect clouds, providing a first-guess of cloudcover for the manual snow cover classification process. Similarly, the forecast snow water equivalent fromSNODAS can provide a first-guess of snow cover for the next manual snow mapping session. These a estimates of snow and cloud cover are intended to improve both the accuracy and speed of manualclassification (Figure 2), and most importantly, enable the estimation of snow cover beneath clouds. 9SNODAS Data Input METARStation Meteorological Obs Rapid Update Cycle (RUC2)NWP Analyses/Forecasts Grid NCEP Stage IV RadarPrecipitation Analyses Grid NESDIS GOESSolar Radiation Grid NOAA GOES/AVHRRCloud Cover, Albedo Data SetsPoint Data Sets Static GriddedGeophysical Data Sets:Elevation, Silvics, Soils Physical Quality Control Figure 3. The gridded data input are physically downscaled from the 40 km NWP modelresolution to 1 km required by the snow model. Ground-based point observations areautomatically quality controlled, used in downscaling, and ingested by the snow model.Physical Downscaling The mesoscale RUC2 atmospheric model output variables are downscaled, using a 1 km DEM, from thenative 40 km resolution to the 1 km resolution required by the snow model. The NOHRSC downscalingprocedures are currently capable of processing higher resolution NWP model output fields as they becomeavailable. The RUC2 model profile variables (i.e., winds, pressure, temperature, and relative humidity),model precipitation, and the half-degree GOES-derived solar radiation product are downscaled to 1 kmand used to force the snow model. The algorithm to downscale the GOES solar radiation product definesincoming solar radiation as the sum of direct, diffuse, and reflected radiation components and usesTOPORAD coupled to the 1 km DEM data to downscale the satellite product (Dozier and Frew, 1990).Precipitation is extracted from the RUC2 data and separated into snow and non-snow and interpolatedover the 1 km DEM. The RUC2 wind data are scaled using a procedure after Liston and Sturm (1998)where the effect of wind downscaling is to increase the wind speed near windward slopes and to decreasethe wind speed near leeward slopes.The thermodynamic profile variables used to drive the snow model (pressure, temperature, and relativehumidity) are downscaled to 1 km using the DEM and observed lapse rates (Figure 3). Unscaled variables 10at all levels in the vertical profile, as well as model level geopotential heightsª, are first smoothed to a 1 kmgrid using a two-dimensional bilinear interpolation. The scaling then proceeds along one of two paths: whenthe 1 km grid elevation exceeds the model elevation, linear interpolation between profile levels is used(Figure 4). When the 1 km grid elevation is below the model elevation, the model profile is extrapolatedto the 1 km grid elevation. This extrapolation of temperatures and virtual temperatures§ to the 1 km gridelevation, when required, is based upon the model lapse rate calculated from smoothed quantities at thesecond and fifth model profile levels.For positive lapse rates, the temperature or virtual temperature is extrapolated linearly from the modelelevation to the 1 km grid elevation. The lapse rate is not allowed to exceed the dry adiabatic lapse rateof about 9.75 K/km, and the lapse rate in virtual temperature is further limited by the constraint that thevirtual temperature cannot fall below the temperature at the 1 km grid elevation. For negative lapse rates(inversion layers), the temperature or virtual temperature at the first model profile level is attributed to the1 km grid elevation.Physical Downscaling of Thermodynamic Variables Thermodynamic Variables(Pressure, Temperature, and Relative Humidity) DEM elevation greater than model elevation? Extrapolate temperature and virtual temperature to DEM elevation; compute pressure via hydrostatic relation. Interpolate pressure, temperature, and virtual temperature to DEM elevation. Derive relative humidity from temperature, virtual temperature, and pressure. No Figure 4. Observed lapse rates derived from station meteorological data are used todownscale the RUC2-generated pressure, temperature, and relative humidity data from40 km to 1 km using DEM data. ª Geopotential height is the height of a given point in the atmosphere in units proportional to thepotential energy of unit mass (geopotential) at this height, relative to sea level.§Virtual temperature is the temperature that dry air must have in order to have the same density asmoist air at the same pressure. 11For pressure extrapolation, the hydrostatic pressure relation is integrated to the 1 km grid elevation,accounting for the lapse rate in virtual temperature. Finally, the temperature, virtual temperature, andpressure that have been extrapolated to the 1 km grid elevation are used to calculate the scaled relativehumidity.Snow Model Updating Observations of snow pack properties (e.g., snow water equivalent or snow pack thickness) can be usedto update the snow model state variables. Table 1 provides the complete summary of the snow model inputand output variables. Once fully implemented, the snow model will be updated with satellite snow cover andwith a variety of airborne and ground-based snow water equivalent and snow depth observations (Figure5). A clear advantage to the SNODAS modeling approach is that all of the available data—ground-based,airborne, satellite, and NWP model data sets—are used to generate the “best estimate” of a gridded snowwater equivalent field at 1 km resolution for the country. Consequently, this approach provides theopportunity to capitalize on the comparatively plentiful ground-based snow depth data heretofore of limiteduse in NWS operational hydrologic modeling.Table 1Snow Model Input and Output VariablesStatic DataDiagnostic Variables Forest cover fractionBlowing snow sublimation rate Soil bulk densityCompaction rate Soil plasticityConductive heat flux Driving DataConvective water flux Surface zonal windLatent heat flux Surface meridional windMelt rate Surface air temperatureNet convection water flux Surface relative humidityNet convection water heat flux Snow precipitationNet long wave radiation flux Non-snow precipitationNet solar radiation flux Solar radiationSensible heat flux State VariablesSnow pack sublimation rate Snow water equivalentSnow pack surface temperature Snow pack internal energyVapor diffusion flux Snow pack thickness Snow pack average temperature Snow pack unfrozen fraction Table 1. Ground-based and airborne observations of snow water equivalent are used to update the snowmodel water equivalent state variable. Additionally, the comparatively plentiful snow depth observationsmade by cooperative observers are used to update the snow pack thickness state variable. Satellite arealextent of snow cover is used to update the presence or absence of snow cover. 12SNODAS Update Data Sets NRCS SNOTEL Snow Water Equivalent NOHRSC GOES / AVHRR Snow Cover CADWR & BC HYDRO Snow Water Equivalent NOHRSC Airborne Gamma Snow Water Equivalent NWS / Cooperative Observer Snow Water Equivalent Snow Depth Point Point Point Quality Control Snow Gridded Data SetsPoint Data SetsFigure 5. Ground-based and airborne snow water equivalent data are used to update thesnow model. Snow depth and satellite-derived areal extent of snow cover observationsare also used to update the model.Rasters for each of the model state variables (Figure 2 and Table 1: snow water equivalent, snow depth,snow temperature (both internal and snow surface), and change in snow pack heat content) and the relevantmeteorological driving data will be made available to end-user over the Internet and over AWIPS. The mostappropriate and effective methods for the 4DDA system remain to be determined and are the subject ofcurrent research activities at the NOHRSC.SNOW MODEL RESULTS AND CONCLUSION The NOHRSC snow model is a physically-based, energy-and-mass-balance snow model for a three-layersnow pack with two layers of soil below. It is run with a horizontal resolution of 1 km. Input data areprimarily outputs from the RUC2 model, scaled from the model’s intrinsic 40-km resolution to the required1 km resolution. The primary driving (input) variables for the model are surface air temperature, relativehumidity, vector winds, precipitation (snow and non-snow), and solar radiation. The primary state variables(input/output) of the model are snow water equivalent, snow pack thickness, and snow pack internalenergy. The initial snow water equivalent required by the model (when initialized in the middle of the snowseason) is generated by interpolating point observations of snow water equivalent and snow depth. Theinitial internal energy is inferred from daily temperature data. 13The SNODAS snow model is not yet operational; there are a number of data ingest, processing, datatransfer, and other mechanical software issues to be resolved. Nonetheless, the initial model runs are quitewww.nohrsc.noaa.go). The web site shows average surface air temperature, total snow fall, total snow melt, snow water equivalent, and snow depth animated at hourly time steps for each of the two periods.said than done.REFERENCES Anderson, E.A. (1976) A point energy and mass balance model of a snow cover, NOAA TechnicalReport NWS 19, Office of Hydrology, National Weather Service, Silver Spring, Maryland.Blöschl, G., and R. Kirnbauer (1971) Point snowmelt models with different degrees of complexity - internalprocesses, Journal of Hydrology, Vol. 129, 127-147.Carroll, T.R. (1985) Snow surveying. in McGraw-Hill 1985 Yearbook of Science and Technology. p.386-388.Carroll, T.R., D.W. Cline, and L. Li (2000) Applications of remotely sensed data at the NationalOperational Hydrologic Remote Sensing Center. Presented at the IAHS, Remote Sensing andCline, D. (1997a) Snow surface energy exchanges and snowmelt at a continental, midlatitude Alpine site,Water Resources Research, 33(4), 689-701.Cline, D. (1997b) Sub-resolution energy exchanges and snowmelt in a distributed SWE and snowmeltmodel for mountain basins, EOS, Transactions, American Geophysical Union, 78(46) Supplement,p. 210.Dozier, J., and J. Frew (1990) Rapid calculation of terrain parameters for radiation modeling from digitalelevation data, IEEE Transactions on Geoscience and Remote Sensing, 28(5), 963-969. 14Hartman, R.K., A.A. Rost, and D.M. Anderson (1996) Operational processing of multi-source snow data.Presented at the Third International Conference/Workshop on Integrating Geographic InformationSystems and Environmental Modeling; Santa Fe, New Mexico; 1996 January 21-25.Jordan, R. (1990) User’s Guide for USACRREL One-Dimensional Snow Temperature Model(SNTHERM.89)U.S. Army Cold Regions Research and Engineering Laboratory, Hanover, NewHampshire.Liston, G.E., and M. Sturm (1998) A snow-transport model for complex terrain. Journal of Glaciology,44(148), 498-516.Miller, P.A., and S.G. Benjamin (1992) A system for the hourly assimilation of surface observations inmountainous and flat terrain, Monthly Weather Review, 120(10), 2342-2359.Pomeroy, J.W., D.M. Gray and P.G. Landine. (1993) The prairie blowing snow model: characteristics,validation, operation. Journal of Hydrology. 144, 165-192.Tarboton, D. G., and, C. H. Luce., 1996. Utah Energy Balance Snow Accumulation and Melt Model(UEB). Utah Water Research Laboratory, Utah University and USDA Forest Service, IntermountainResearch Station, 41 p.Tarpley, D., R. Pinker, I. Laszlo, and K. Mitchell (1997) Surface and cloud products for validation ofregional NWP models, GEWEX Continental-Scale International Project (GCIP) MeetingAbstracts, University Consortium for Atmospheric Research/National Center for AtmosphericResearch, November 5, Boulder, CO, p. 39.