/
Estimating snow-cover trends from space Estimating snow-cover trends from space

Estimating snow-cover trends from space - PowerPoint Presentation

gabriella
gabriella . @gabriella
Follow
65 views
Uploaded On 2023-09-25

Estimating snow-cover trends from space - PPT Presentation

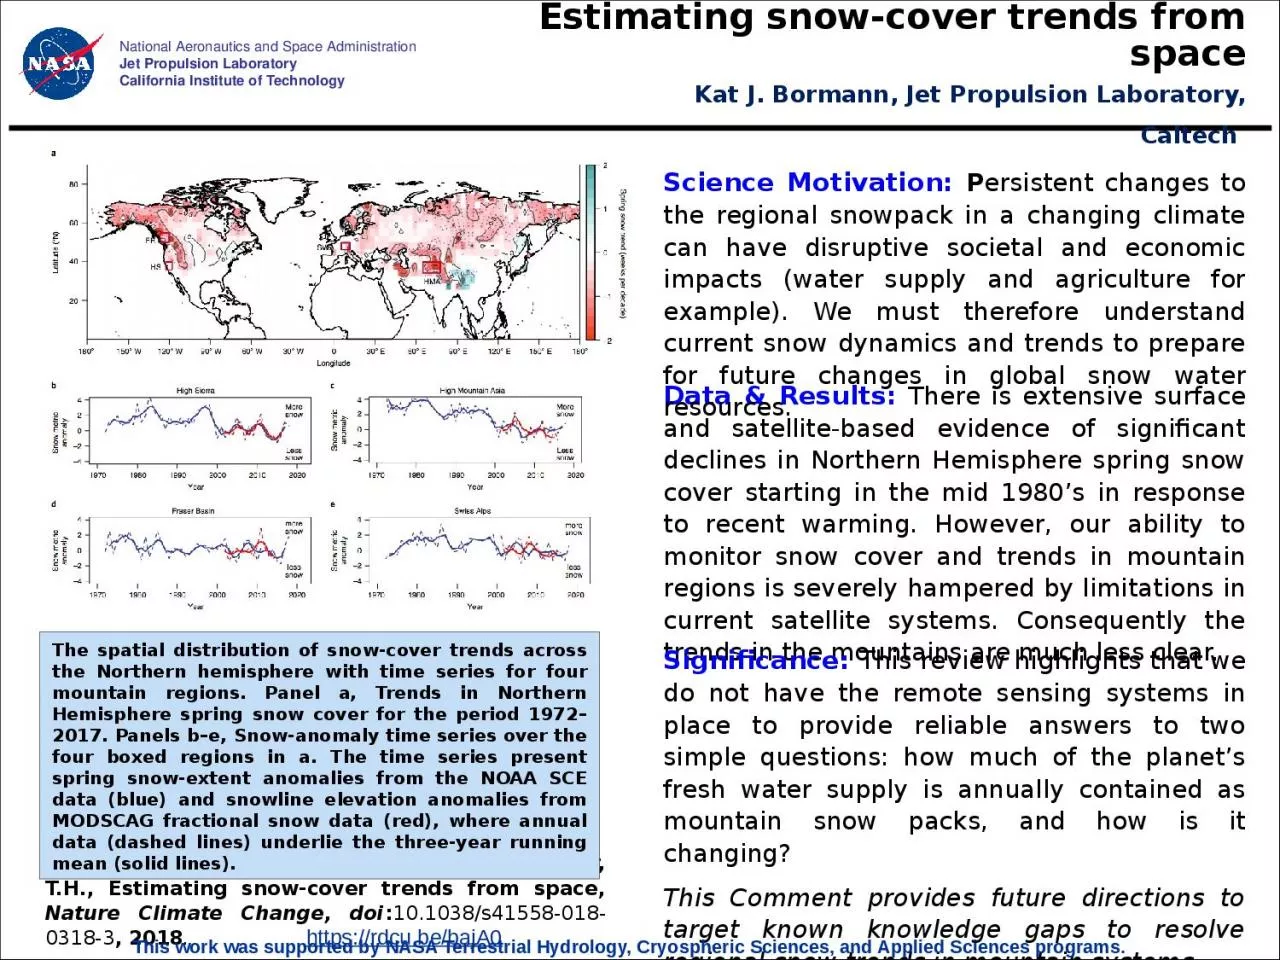
Kat J Bormann Jet Propulsion Laboratory Caltech Data amp Results There is extensive surface and satellitebased evidence of significant declines in Northern Hemisphere spring snow cover starting in the mid 1980s in response to recent warming However our ability to monitor snow cover ID: 1021184

trends snow cover data snow trends data cover space series time hemisphere northern mountain regions spring climate bormann lines

Share:

Link:

Embed:

Download Presentation from below link

Download Presentation The PPT/PDF document "Estimating snow-cover trends from space" is the property of its rightful owner. Permission is granted to download and print the materials on this web site for personal, non-commercial use only, and to display it on your personal computer provided you do not modify the materials and that you retain all copyright notices contained in the materials. By downloading content from our website, you accept the terms of this agreement.


Presentation Transcript

1. Estimating snow-cover trends from space Kat J. Bormann, Jet Propulsion Laboratory, Caltech Data & Results: There is extensive surface and satellite-based evidence of significant declines in Northern Hemisphere spring snow cover starting in the mid 1980’s in response to recent warming. However, our ability to monitor snow cover and trends in mountain regions is severely hampered by limitations in current satellite systems. Consequently the trends in the mountains are much less clear.Bormann K.J. Brown, R.D., Derksen, C., Painter, T.H., Estimating snow-cover trends from space, Nature Climate Change, doi:10.1038/s41558-018-0318-3, 2018. https://rdcu.be/bajA0 National Aeronautics and Space AdministrationJet Propulsion LaboratoryCalifornia Institute of TechnologyScience Motivation: Persistent changes to the regional snowpack in a changing climate can have disruptive societal and economic impacts (water supply and agriculture for example). We must therefore understand current snow dynamics and trends to prepare for future changes in global snow water resources. Significance: This review highlights that we do not have the remote sensing systems in place to provide reliable answers to two simple questions: how much of the planet’s fresh water supply is annually contained as mountain snow packs, and how is it changing? This Comment provides future directions to target known knowledge gaps to resolve regional snow trends in mountain systems. The spatial distribution of snow-cover trends across the Northern hemisphere with time series for four mountain regions. Panel a, Trends in Northern Hemisphere spring snow cover for the period 1972–2017. Panels b–e, Snow-anomaly time series over the four boxed regions in a. The time series present spring snow-extent anomalies from the NOAA SCE data (blue) and snowline elevation anomalies from MODSCAG fractional snow data (red), where annual data (dashed lines) underlie the three-year running mean (solid lines). This work was supported by NASA Terrestrial Hydrology, Cryospheric Sciences, and Applied Sciences programs.

2. National Aeronautics and Space AdministrationJet Propulsion LaboratoryCalifornia Institute of TechnologyContact: Kat Bormann, MS 300-331, Jet Propulsion Laboratory, Pasadena, CA 91109kathryn.j.bormann@jpl.nasa.govCitation:Bormann, Kat J., Ross D. Brown, Chris Derksen, and Thomas H. Painter. 2018. “Estimating Snow-Cover Trends from Space.” Nature Climate Change, October. https://doi.org/10.1038/s41558-018-0318-3.Data Sources: The data used for this study can be downloaded from:NOAA Snow Cover Extent Climate Data Record (CDR) v01r01Rutgers University Global Snow Lab (https://climate.rutgers.edu/snowcover/)European Space Agency’s GlobSnow-2 v1r1 (http://www.globsnow.info/swe/archive_v2.0/) MODIS Snow Covered-Area and Grain size retrieval (MODSCAG) (https://snow.jpl.nasa.gov/portal/) Interactive Database of the World’s River Basins (http://riverbasins.wateractionhub.org/) Technical Description of Figure:The spatial distribution of snow-cover trends across the Northern hemisphere with time series for four mountain regions. a, Trends in Northern Hemisphere spring snow cover for the period 1972–2017 from NOAA-SCE. Stippled areas mark statistical significance at the 95% level. b–e, Snow-anomaly time series over the four boxed regions in a. The time series present spring snow-extent anomalies from the NOAA SCE data (blue) and snowline elevation anomalies from MODSCAG fractional snow data (red), where annual data (dashed lines) underlie the three-year running mean (solid lines).