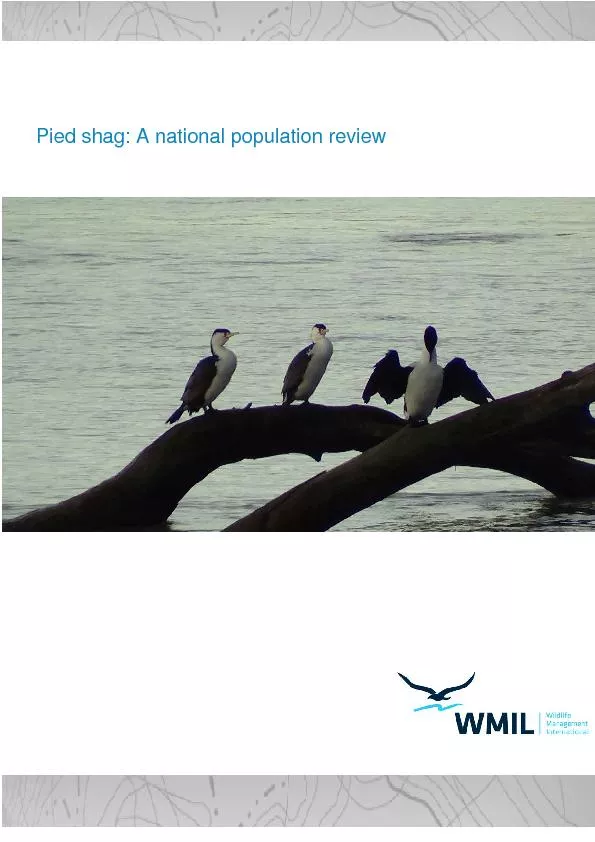
/
Pied shag: A national population review Pied shag: A national population review

Pied shag: A national population review - PDF document

alexa-scheidler
alexa-scheidler . @alexa-scheidler
Follow
440 views
Uploaded On 2016-07-09

Pied shag: A national population review - PPT Presentation

This report was prepared by Wildlife Management International Limited for the Department of Conservationfulfilment of Contract 4349 POP201107 Pied shag population reviewDecember 2013Wildlife Manageme ID: 397185

This report was prepared

Share:

Link:

Embed:

Download Presentation from below link

Download Pdf The PPT/PDF document "Pied shag: A national population review" is the property of its rightful owner. Permission is granted to download and print the materials on this web site for personal, non-commercial use only, and to display it on your personal computer provided you do not modify the materials and that you retain all copyright notices contained in the materials. By downloading content from our website, you accept the terms of this agreement.


Presentation Transcript

Pied shag: A national population review This report was prepared by Wildlife Management International Limited for the Department of Conservationfulfilment of Contract 4349: POP201107 Pied shag population reviewDecember 2013Wildlife Management International LimitedPo Box 607BlenheimMarlborough 7240New ZealandEmail: info@wmil.co.nz Web: www.wmil.co.nz ContentsAbstractIntroductionMethodsResultsSummary of existing knowledge of breeding biologyImpacts of nonseasonal breeding on population estimatesData collectionBreeding distributionCurrent population sizePopulation trendsNational population trendsRegional population trendsOther available population trend dataColony sizeBreeding habitatBanding studiesLongevity and movementsCauses of mortalityThreatsFishing gear entanglement at coloniesColony removalDiscussionRecommendationsAcknowledgementsReferences cited Pied shag: A national population reviewMike BellWildlife Management international Limited, PO Box 607, Blenheim, Marlborough 724, New Zealand. Email: mike@wmil.co.nz AbstractA population review of pied shags was carried out by collating colony records from a wide range of sources including published and unpublished “grey” literature,web based recording schemes, and observations from bird watchers. Over 1500 colony records were found for the period 19342013. Using colony count data, the present national population of pied shag was estimated at 3,159 breeding pairs. Extrapolating for breeding age birds not nesting at the time of counts the breeding population is estimated at 6, 400 breeding pairs. The breeding distribution is disjunct, with breeding occurring in three areas; northern North Island (from Wairoa north), central New Zealand (wellington to Canterbury) and the southern South Island (Southland and Stewart Island).The pied shag population has been increasing since the 1950’s, from an estimated 719 breeding pairs in 42 colonies; to 3,159 breeding pairs in 220 colonies in the 2000’s; an annual increase of approximately 2.3%. There has been some variation regionally in the rate of population increase. The northern North Island population has increased slower (1.5% per annum), than the central New Zealand population (5.4%), which has expanded into Nelson and Wellington. Unfortunately data from the southern South Island population is too limited to evaluate trends for this region.Pied shags generally nest in small colonies (mean 18.5 nests, range 1118), with 58% of colony counts under 15 nests and 85% with fewer than 30 nests. Pied shag colonies were almost exclusively found in marine habitats (87.7%) and the small proportion of colonies in fresh water habitats were all within 4.2 km of the sea (mean 1.2, range 0.14.2km, n = 34). Nests were predominately found in native vegetation (72.6%), with introduced vegetation of lesser importance and only two colonies were found on manmade structures.Results from banded birds show that the oldest bird lived to 18 years old, and birds are relatively sedentary. Recoveries or resightings of both juvenile and adult birds were close to the colony where they were banded; juvenile mean 11.3 km (range 039 km), adult mean 12.5 km (range 023 km).The breeding biology of pied shags in New Zealand is reasonably well known. Significantly, birds breed all year round, which has implications when estimating the national population. Pied shags were observed to die at colonies after becoming entangled by fishing line which was attached to a hook imbedded in the bird. This was seen at 9 (13%) of 67 northern North Island colonies visited during field surveys in 2012/13. Recently two colonies have been removed by the local Councils following complaints by residents. Recommendations for further work are provided. IntroductionThe pied shag (Phalacrocorax varius) is a large (male 2.2 kg, female 1.7 kg) predominantly black and white shag which primarily inhabits inshore coastal waters and estuaries (Marchant and Higgins 1990). Two subspecies are recognised; Phalacrocorax varius variusfound in New Zealand and Phalacrocorax varius hyploleucus found in Australia (Checklist committee 2010).Pied shag is generally considered widespread and moderately common, with a population of 5,00010,000 pairs estimated by Heather and Robertson (1996), and a threat ranking of National Vulnerable (Robertson et. al. ). However it is likely that the population was formerly more numerous and widespread; with pied shags suffering heavy persecution in the early 1900’s (Oliver 1930).Pied shag was identified at a highmoderate risk from fishing, primarily from poorly observedsetnet, inshore drift net and beach seine fisheries(Rowe 2013)At present there are no mitigation measures in place in these fisheries to protect shags, and the impacts on the population are unknown. Bycatch has also been recorded in commercial bottom longline fisheries (e.g. CSP 2010), and little is known about bycatch in recreational fisheries.Determining fisheries related risk to pied shag is problematic as little is known about their population size and breeding distribution.This study aimed to collate all existing knowledge to evaluate the population size and trends of pied shag in New Zealand.MethodsThis population review was carried out by collating all available pied shag colony records. A colony record consisted of a dated observation confirming breeding at a specified location. The most useful data included a count of occupied nests, though some records only indicated the presence of a colony. Data was compiled from a range of sources, including carrying out a literature review where colony records were gleaned from published papers and “grey literature” unpublished reports (mainly form Government agencies). In addition individual observers were encouraged to submit colony records following advertisement of the project through the Ornithological Society of New Zealand (via Annual Conferences, Southern Bird and BirdingNZ web groups) and the Department of Conservation Area Offices. Followingon from the initial data collection, in September 2012 WMIL staff carried out field surveys on foot searching allmainland colony locations recorded from the Bay of Plenty north to Cape Regina. In addition to confirming the presence or absence of coloniesnew additional colonies were searched for. Surveys in this region were especially important to check on colony status of a large number of colonies which did not have recent records (20+ years). All colony records, from both the review and field surveys,were recorded and stored in a GIS linked database. Fields recorded were colony name (name assigned to each colony usually a location name), OSNZ region, habitat (including marine/freshwater and colony exposure), colony tree species, latitude and longitude, observation date, nests present, nest count, breeding stage, other species breeding at colony, other notes, and record source (either quoted published paper or unpublished report, or name of observer).When estimating population trends data was pooled into decades with the maximum count recorded for that decade used. With 1950’s referring to 195059, 1960’s being 196069, etc. Data from 1950’s also includes 10 counts from 1934 to 1949; and from the 2000’s includes all colony records up until 2013. For colonies where there was only presence data for a particular decade, the mean of counts for the decade either side is used (Table 1). Table 1. Example of estimating population trends from presence data.A)Data extracted from database Maximum count for each decade, during the 1980’s the colony was only recorded as being present, with no count data.1950's1960's1970's1980's1990's2000's Whale Island/ Moutohora 10 P 15 14 B)Estimated population for 1980’s determined by the mean of counts from 1970’s and 1990’s.1950's1960's1970's1980's1990's2000's Whale Island/ Moutohora 10 13 15 14 ResultsSummary of existing knowledge of breeding biologyThe breeding biology of pied shags is reasonable well known, with two detailed studies of pied shag breeding biology being conducted in New Zealand (Millener 1972; Powlesland et. al. 2008). The breeding parameters of pied shag in New Zealand are summarisedbelowBreeding habitatOf 21 colonies studied from 196972 Millener (1972) found 76% were marine, and 24% freshwater, although all of these were within 400m of the sea. Most colonies (67%) where found in shelters harbours, estuaries or lakes, with fewer (33%) on exposed coasts or islands. Breeding seasonEggs laid year round, however two peaks of egg laying recorded; FebMay and AugOct (Millener 1972; Powlesland et. al. 2008). However all colonies showed some irregularity in breeding timing, in particular in smaller colonies (Millener 1972). Both Millener (1972) and Powlesland et. al. (2008) thought that breeding outside of peak periods was by young inexperienced breeders.NestThe nest is a raised platform of sticks, twigs and foliage measuring 80cm in diameter (range 140cm), with a nest bowl lined with fibrous material such as flax, grass or seaweed. Most nests are used twice a year, and are refurbished at the start of each breeding attempt(Millener 1972; Powlesland et. al. 2008). EggsPale blue when laid, but colour rapidly obscured as eggs become stained brownish; mean egg dimensions 59.2 x 38.1mm and weight 46.7g (2.7% of female weight) (Millener 1972).Clutch sizeMean 3.35, range 25; with 2 days between each egg laid (Millener 1972). Incubation period28.8 days, range 2533 days, shared by the sexes (Millener 1972).Nestling period53.2 days, range 4760 days (Millener 1972).Age at independence133 days (Millener 1972).Breeding successBreeding success of between 4575% recorded (Millener 1972; Powlesland et. al. 2008).Age at first breedingMinimum age 2 years, mean not known (limited data available) (Millener 1972). Breeding periodCourtship mean 15 days (range 530); nest building 21.4 days (457 days); incubation 28.8 days (2533 days); chick rearing 53.2 days (4760 days); post fledgling care min 30 days, max 80 days. Therefore the full breeding cycle takes between 4 Months (minimum ranges)and 9 months (maximum ranges), but is the average is probably around six months of average, and each pair is likely to breed once per year despite the two peaks in egg laying (Millener 1972).Impacts of nonseasonal breeding on population estimatAs described above there have been two detailed studies of pied shag in New Zealand; Millener (1972) in multiple colonies in Auckland, and Powlesland et(2008) at a developing colony in Makara (Wellington). Both show a similar breeding pattern with two peaks of egg laying (recorded as clutches started each month), a spring and autumn peak (Table 2). Table 2. The percentage of clutches started each month during studies of pied shag breeding biology. JanFebMarAprMayJunJulAugSepNovDec Millener (1972)1.56.614.16.96.03.03.915.321.613.55.72.1 Powlesland et. al. (2008) 2.620.119.55.23.21.35.89.120.17.83.21.9Average2.013.416.86.04.62.14.912.220.810.64.52.0 The breeding cycle takes on average 6 months, of which five months would have birds present at nest sites (courtship, nest building, incubation and chick rearing) (Millener 1972). Hence the proportionof the population breeding at any one time is estimatedby extending the percentage of clutches laid each month by the five month nest occupation period (Table 3). As would be expected, the estimated percentage of the population breedingeach month follows a similar two peak pattern; with the estimated proportion of the population breeding during SeptDecbeing 4555%; and between MarJune around 40%. As such any colony count is only recording up to 55% of the entire breeding population. Table 3. The estimated proportion of pied shags breeding at a colony each month, determined from percentage of clutches initiated each month. Clutch Estimated percentage population breeding initiated Jan Feb Mar Apr May Jun Jul Aug Sep Oct Nov Dec Jan 2 2 2 2 2 Feb 13.4 13.4 13.4 13.4 13.4 Mar 16.816.816.816.816.8 Apr 6 6 6 6 6 May 4.6 4.6 4.6 4.6 4.6 Jun 2.12.12.12.12.1 Jul 4.9 4.9 4.9 4.9 4.9 Aug 12.2 12.2 12.2 12.2 12.2 Sep20.8 20.820.820.820.8 Oct 10.6 10.6 10.6 10.6 10.6 Nov 4.5 4.5 4.5 4.5 4.5 Dec 2 TOTAL 39.9 32.5 38.7 40.2 42.8 42.9 34.4 29.8 44.6 50.6 53 50.1 Millener (1972) noted that most colonies show some irregularity in timing of breeding, and that smaller colonies often did not have birds laying in all months. Likewise Powleslandet. al. (2008) did not record laying in all months until 2001, when the colony was 6 years old with over 10 nests present. As such a blanket correction factor for all colonies is probably note warranted.Due to the uncertainty of overall correction factorfor all colonies regardless of size, and limited data during earlier decades of this study, figures used in this report are colony counts. As such ishould be noted that these figures are a minimum numbers, and that the total population is likely to be 5060% higher. DatacollectionA total of 1512colony records were collected from a wide range of sources; includingPublished papers 39% of all colony records came from published sources; primarily Notornis” and in particular Classified Summarised Notes.“Grey literature”15% of records come from unpublished reports; including a significant number of unpublished Wildlife Service reports held in National Archives, but data come from a wide range of other non published reports Individual observers 38% of all records were supplied by individual observers (primarily OSNZ members and DOC staff) following advertised requests for information on pied shag colonies. A significant pool of data was forwarded by Northland OSNZ who maintained a shag colony register in the 1970’s90’s for their region.Data recorded in electronic databases (i.e. OSNZ’s ebird and DOC’s Bioweb) are included here.WMIL surveys % of records were a result of specific surveys arried out by WMIL staff as part of this contract. The number of colony records over timenot even(Figure 1); with limited colony records prior to the 1970’s. The amount of data increases during the 1970’s and 80’s when the use of Classified SummarisedNotes published in “Notornis” was at its strongest.The significant amount of data collectfor the 2000’s is primarily a result of survey work carried outby WMILFigure 1. Proportion of colony records for pied shag recorded each decade since the 1950’s. Data for the 1950’s includes 10 records from 193449, and records for the 2000’s includes records up to 2013.Breeding distributionA total of 293 pied shag colonies were recorded between 1934 2013. Breeding wasrecorded fromthe top of the North Island to the bottom of Stewart Island, but the breeding distribution is disjunct (Figure 2). Colonies are located in three distinct areas of the countryNorthern North Island with colonies from Wairoaup and around the East Cape, Bay of Plenty, Coromandel, South Auckland, Auckland, Northlandand the Far North.Central New Zealand with colonies in Wellington, Nelson, Marlborough and CanterburySouthern South Islandwith colonies in Fiordland, Southland and Stewart Island 1950's1960's1970's1980's1990's2000'sFrequency (%) Figure 2. Location of all reported breeding colonies pied shag; 19342013. Current population sizeUsing colony count data the present national population of pied shag is estimated at 3,159 breeding pairs. Extrapolating for breeding aged birds not breeding at the time of the count, the estimated national population is 6,400 breeding pairs.To determine the present population size of pied shag accurate data is available for the northern North Island and central New Zealand breeding areas, but is limited for the southern South Island. To estimate the population from the southern South Island I took the maximum count for each colony location and combined this with the accurate counts from the northern North Island and central New Zealand.Most pied shags are found in the top half of the North Island; with the northern North Island population comprising 57% of the national population, central New Zealand 38% and the southern South Island 5%.Population trendsNational population trendsThe number of breeding pairs and colonies of pied shags in New Zealand has been increasing since the 1950’s (Figure 3). As previously mentioned, figures used in this report are colony counts, although this represents a minimum total population size it is likelyto better represent population trends due to the high number of small establishing colonies which may not have year round breeding.In the 1950’s there was an estimated 719 breeding pairs found in 42 colonies, 50 years later during the 2000’s there is an estimated 3159 breeding pairs in 220 colonies; an annual increase of approximately 2.3%.Figure . Population trend of pied shags in New Zealand 1950’s 2000’s. Black line estimated number of breeding pairs; grey line number of breeding colonies. 0 50 100 150 200 250 0 500 1000 1500 3000 3500 1950's 1960's 1970's 1980's 1990's 2000's ColoniesBreeding pairs Regional population trendsNorthern North IslandThe number of breeding pairs and colonies of pied shags in breeding in the northern North Island as been increasedsince the 1950’s, although during the 1970’s 1990’s the population stabilisedat around 1,500 breeding pairs (Figure 4). In the 1950’s there was an estimated 630 breeding pairs found in 32 colonies, 50 years later during the 2000’s there is an estimated 1785 breeding pairs in 115 colonies; an annual increase of approximately 1.5%.Figure pulation trend of pied shags breeding in the northern North Island 1950’s 2000’s. Black line estimated number of breeding pairs; grey line number of breeding colonies. There have been considerable population fluctuationsin regions throughout the northern NorthIsland breeding range. With most regions seeing a decrease in breeding numbers at same stage during the 1960’s 1990’s(Figure 5). Both the breeding populationand breeding range has increased significantly in the last decade (Figure 5and ). In particular there has been an expansion of the breeding range into the Bay of Plenty and Gisborne/East Cape (Figure and ). 1950's1960's1970's1980's1990's2000'sColoniesBreeding pairs Figure . Population trends of pied shags from different regions breeding in the northern North Island 1950’s 2000’s. Black line estimated number of breeding pairs; grey line number of breeding colonies. Far North Northland 0 10 20 30 50 0 200 400 600 800 Auckland South Auckland Bay of Plenty 0 10 20 0 200 Gisborne/Wairoa Figure . Distribution of pied shag breeding colonies in the northern North Island 1970’s2000’s. Central New ZealandThe number of breeding pairs and colonies of pied shags in breeding in central New Zealand has increased since the 1950’s, especially since the 1980’s (Figure 7). In the 1950’s there was an estimated 46 breeding pairs found only 5 known colonies, 50 years later during the 2000’s there is an estimated 1,204 breeding pairs in 90 colonies; an annual increase of approximately 5.4%.Figure . Population trend of pied shags breeding in the central New Zealand1950’s 2000’s. Black line estimated number of breeding pairs; grey line number of breeding colonies. There has been considerable population growth in regions throughout the central New Zealand breeding range (Figure 8). This has been driven from Marlborough and Canterbury which had the only colonies in until the late 1970’s(Figure 8 and 9). Since the 1980’s pied shag numbers have dramatically increased in Marlborough and Canterbury, with the population expanding intoNelson and Wellington (Figure 8and ). 1950's1960's1970's1980's1990's2000'sColoniesBreeding pairs Figure . Population trends of pied shags from different regions breeding in central New Zealand 1950’s 2000’s. Black line estimated number of breeding pairs; grey line number of breeding colonies. Wellington Marlborough 0 20 40 60 Nelson 0 20 40 0 200 400 600 Canterbury Figure 9. Distribution of pied shag breeding colonies in central New Zealand1970’s2000’s. Southern South IslandUnfortunately the data for the southern South Island breeding range is toolimited to determine population trends for this area. Here the population is estimated by using the maximum recorded count at each colony; the estimated population is 170 breeding pairs. Pied shags are breeding in Fiordland, Southland and Stewart Island (Figure 10).Figure 10. Breeding locations of pied shags in the southern South Island.Other available population trend dataOSNZ Beach patrol dataThe Ornithological Society of New Zealand has carried out a Beach Patrol Scheme since the 1950’s. Pooling data for all regions, the number of pied shags recovered/100km of beach patrolled has increased over time (Figure 1). Figure 1Number of pied shags recovered per 100km of beach patrolled 19602000; Ornithological Society of New Zealand Beach Patrol Scheme. 0.050.10.150.20.250.3Shags recovered/ 100kmYear Colony sizePied shags generally nested in small colonies; with the averagesize 18.5 nests (range 1118)In total 58% of colony countsareunder 15 nests and 85% of colony counts fewer than30 nests(Figure 1Figure 1Colony size of pied shag colonies recorded in New Zealand 19342013.Breeding habitatPied shag colonies were almost exclusively found in marine habitats, with 87.7%of colonies found in along the coastline in sheltered bays or coves(65.6%), exposed coastal areas(6.8), river or stream mouths(6.4%)or within estuaries(8.9%)(Figure ). A small proportion of colonies are found in fresh water habitats (12.3%), including freshwater lakes, up rivers or on sewage ponds. Of these colonies found on freshwater, all are close tothe sea (mean 1.2, range 0.14.2km, n = 34)Figure . Habitat preference of pied shag breeding colonies in New Zealand 19342013 0 5 10 15 20 25 Frequency (%)Colony size (number of nests) 0 10 20 60 70 Sheltered Bay/Cove Exposed coastRivermouthEstuaryLakeRiverSewage pondMarineFreshwaterFrequency (%) Of the 172 colonies where the tree species was recorded most (72.6%) werefoundin native vegetation; and this was dominated by Pohutukawa. Fewer colonies (22%) were found in introduced vegetation; primarily Pine and Macrocarpa. Only two colonies were found on manmade structureson a maimai and old disused wharf(Figure Figure . Vegetation preference of pied shags breeding in New Zealand19342013Banding studiesLongevity and movementsA total of 173 pied shags have been banded in New Zealandbetween 1951 and 2011, with all but one of those banded during 19511982. Most birds were banded in 19691972, including 91 individually colour banded birds, as part of a wider MSc study on pied shags (Millener 1972). Most of the birds have been banded aschicks (127 chicks, 41 Juveniles, 4 adults, 1 age not recorded the 2011 bird which was the banding of a released rehabilitated bird), which means that most recoveries are of known aged birds.There is been a relatively high recovery rate, with 35% of birds recovered or colour banded birds resighted; including repeat resightings of some of the colour banded birds. The oldest bird lived to 18 years old; which is comparable to the 20 years recorded in Australia (Marchant and Higgins 1990).Pied shags haveonly been recorded moving a small distance from the colony (banding location). Recoveries or resightings of juvenile birds (1 year old birds), were on average 11.3 km from the banding location (range 039 km). Recoveries of adult birds (&#x-300;1 year old) were on average 12.5 km from the banding location (range 023 km).Causes of mortalityThe cause of death has been recorded for only 13 recovered banded pied shags; 1 was shot (in 1970 when pied shags were unprotected), 1 died in an oil spill, 1 was caught ona fishing line (was not PohutukawaBroadleafScrubBeechMangroveOtherPineMacrocarpaWillowOtherStructureNativeIntroducedManFrequency (%) recorded if commercial or recreational) and 8 have been killed in fishing nets (again not recorded if commercial or recreational).ThreatsFishing gear entanglement at coloniesDuring the survey a number of people reported pied shags killed at colonies after becoming entangled by fishing line which was attached to a hook imbedded in the bird (Figure 14). The distribution of these reports was from across the country (Figure 15), and suggest that this is a widespread issue. In order to collect quantitative data around this issue, all colonies were carefully searched for the presence of dead entangled birds during the systematic survey of northern North Island. Of 67 colonies checked 9 (13%) had birds killed by fishing line, all fishing gear appeared to be recreational(Figure 15B) Figure 14. Pied shag killed after becoming entangled in fishing line from imbedded hook. Photo: Willie Cook Figure 15. A: Distribution of pied shags reported dead after becoming entangled in fishing line. B: Distribution of pied shags found dead after becoming entangled in fishing line during surveys of 67 northern colonies. A B ColonyremovalTwo colonies (one in Nelson and one in Wellington) were reported to have been removed by the local Council following complaints about noise and smell by residents. A number of people reported that locals have raised concerns to local Councils over the proximity of pied shag colonies but no action to remove colonies has happen as yet. DiscussionAlthough previous to this study there was little known about the population size and trends of pied shag, this study has shown that there is a large volume of data about pied shags in published and “grey” literature, coordinated recording systems (i.e. OSNZ’s webbased ebird) and in notebooks of bird watchers. In particular the large number of observations forwarded by members of the Ornithological Society of New Zealand has been invaluable. Collating this data has made it possible to estimate the population size and trends of pied shag. This study highlights how much information has been recorded about New Zealand bird species, but is held in scattered variable sources, and if collated can provide information on national population sizes and trends. The breeding biology of pied shags in New Zealand is reasonably well known (Millener 1972; Powlesland et. al. 2008). Birds breed all year round, with two peaks in egg laying(FebMay and AugOct). Millener (1972) considered that a full breeding cycle took 6 months (range 49 months), so concluded that each pair bred only once each year. As such, not all of the population is breeding at any one time, and this has significant impacts on estimating the national population. To estimate the entire national population it is equally important to consider the proportion of breeding birds which will not be present at a colony at the time of the census.The pied shags breeding population was split into three distinct areas; northern North Island (Wairoa north), central New Zealand (Wellington to Canterbury), and southern South Island (Southland and Stewart Island). By using colony count data the present breeding population is estimated at 3,159 pairs; extrapolating for birds not breeding at the time of the count, the estimated national population is 6,400 breeding pairs. With 57% of the population in the northern North Island, 38% in central New Zealand and only 5% in the southern South Island. The breeding distribution reported here is similar to that described by Robertson et. al. (2007).Given the increasing population trend observed, the national population estimate reported here is lower than previous population estimates of 5,010,000 breeding pairs in 1996 (Heather and Robertson 1996).With this study reporting a significant population increase, it is clear that past attempts have overestimated the breeding population. This highlights the difficulty of estimating national populations of highly visual widespread seabird species such as shags without undertaking extensive data reviews and/or targeted surveys.Pied shags were heavily persecuted in the early 1900’s (Oliver 1930) and the population was much reduced. This study shows that since the 1950’s the pied shag population has been increasing, and their range expanding. The national population has increased at an estimated 2.3% per annum. Population increase is also confirmed by OSNZ beach patrol data, which has seen an increase in recovery rates of pied shags found dead on beaches. The present expansion of breeding range, is in fact likely to be birds recolonising the former range of the species. Although the national population is increasing, there are some regional differences in rate of population increase and expansion. The northern North Island population has shown slower growth (1.5% per annum); the Far North population has remained stable; Northland initially increased to the 1980’s but has since been declining; Auckland, South Auckland and the Bay of Plenty has seen steady gradual growth; whilst Gisborne/Wairoa has increased sharply since the 1990’s.In comparison the central New Zealand population has experienced rapid population growth (5.4% per annum), and significant range expansion. In the 1950’s pied shags were only recorded breeding in Marlborough and Canterbury, but have now expanded into Nelson and Wellington. Unfortunately data from the southern South Island population is too limited to determine population trends there. The drivers of different growth rates in regional populations, and in particular the stable or declining populations in the Far North and Northland are not known. Likely factors include; the availability of suitable foraging habitat, prey availability, availability of suitable breeding habitat, impacts of fisheries (both commercial and recreational), impacts of introduced predators, and human disturbance. Most pied shags breed in small colonies, with over half of the colonies numbering less than 15 pairs, and great majority numbering fewer than 30 pairs. The preference for birds to breed in small colonies has probably led to expansion of their breeding range, rather than expansion of existing colonies, particularly as seen in Gisborne/Wairoa,Wellington, Nelson and Canterbury. Pied shag breeding is almost exclusively restricted to marine habitats, with few colonies recorded on freshwater lakes, further up rivers or on sewage ponds. Nests are predominately in native vegetation, and the presence of native vegetation to the water’s edge is likely to be important in maintaining breeding habitat for pied shags. The high number of nests recorded in Pohutukawa is testament to the high proportion of birds breeding in the northern North Island, and thedominance of Pohutukawa in northern coastal environments.Results from banding show that pied shags do not disperse far from their colonies, confirming that pied shag are generally sedentary although some juvenile dispersal is reported (Marchant and Higgins 1990), leading to the gradual expansion of range observed.This study identified two potentially significant threats for pied shags. A relatively high number of pied shags were found dead in colonies following entanglement by fishing line. As it is notknown the time it would take for a pied shag corpse to decay and fall free it is difficult to quantify mortality rates. However, given that during a 3 week period, dead birds were found in 13% of colonies visited, it suggests that this may be a significant cause of mortality. Although not retrieved, most of this fishing tackle appeared to be from recreational fishing, and such fishing could be a major source of mortality. Pied shags have also been reported killed in set nets and inshore long lines (CSP 2010; Ramm 2012; Rowe 2009). Two colonies were reported to have been removed by felling of breeding trees by local councils following complaints by residents. Conflict between people and shags is likely to continue as the country’s population continues to grow with more coastal housing and subdivision occurring. Given the importance of coastal vegetation to pied shag breeding, increased coastal development is likely to impact on pied shag populations.RecommendationsEstimating the national pied shag population is complicated by annual breeding in the species. Investigation into the proportionof thepopulation breeding at any one time is recommended and will enable more accurate estimates of the national pied shag population.This study should aim at lookinginto the variability in breeding in relation to colony sizeThe foraging range of breeding pied shags is not well known, and to better understand the possible risks of commercial and recreational fishing on pied shags an investigation using GPS tracking should be carried out.Investigation of the impacts ofrecreational fishing, and in particular line entanglement on pied shags is recommended.Promoting advocacy for pied shags is recommended to reduce possible negative human shag interactionsThis studyhighlights that there is considerable data available to undertake national population reviews of species where it is presently considered that little is known about their population trends. Similar reviews of other species considered at moderate to high risk from fisheriesand other humaninducedimpacts are recommended.This study highlights the need to undertake intensive data investigations when determining the population size and trends of highly visible apparently common seabirds such as shags. When undertaking population reviews that involve requesting observations from members of the Ornithological Society of New Zealand it is recommended that timeframes should be long enough to span two National Conference periods (1824 months). This way enough me is provided to present preliminary results and request additional observations.AcknowledgementsThis project would not have been possible without the help of many people supplying observations of pied shag colonies; I am very grateful to everybody who supplied observations. In addition I thank the Ornithological Society of New Zealand who provide Beach Patrol Scheme data and who facilitated requests for data from their membership. This project was funded by the Department of Conservation’s Conservation Services Programme (htt://www.doc.govt.nz/csp) project POP201107 Pied shag population review. Thanks to WMIL staff, and especially Kelvin Floyd who developed the GIS linked database for data collection, and produced the maps used in this report. References citedChecklist Committee (OSNZ). 2010. Checklist of the birds of New Zealand, Norfolk and Maquarie Islands, and the Ross Dependency, Antarctica th ed.). Wellington: Ornithological Society of New Zealand and Te Papa PressConservation Services Programme 2010. Protected species interactions with the snapper (Pagrus auratus) demersal longline fishery in FMA 1. DOC Marine Conservation Services Series 6.Department of Conservation, Wellington. 23 p.Heather, B.D.; Robertson, H.A. 2005. The field guide to the birds of New Zealand. Viking, Auckland.Marchant, S.; Higgins, P.J. (eds.) 1990. Handbook of Australian, New Zealand and Antarctic birds. Vol. ratites to ducks. Oxford University Press, Melbourne.Millener, P.R. 1972. The biology of the New Zealand pied cormorant Phalacrocorax varius varius Gmelin (1789). Unpubl. MSc Thesis, University of Auckland, Auckland, New Zealand.Oliver, W.R.P. 1930. New Zealand Birds. A.H. & A.W. Reed limited, Auckland.Powlesland, R.G.; Sharp, S.E.; Smith, A.N.H. 2008. Aspects of the breeding biology of the pied shag Phalacrocorax varius) at Makara Beach, Wellington, New Zealand. Notornis 55: 69Ramm, K. 2012 Conservation Services Programme Observer Report: 1 July 2009 to 30 June 2010. Department of Conservation, Wellington. 103 p. Available for download at http://www.doc.govt.nz/Robertson, C.J.R.; Hyvonen, P.; Fraser, M.J.; Pickard, C.R. 2007. Atlas of bird distribution in New Zealand, 19992004. Ornithological Society of New Zealand, WellingtonRobertson, H.A.; Dowding, J.E.; Elliott, G.P.; Hitchmough, R.A.; Miskelly, C.M.; O’Donnell, C.J.F.; Powlesland, R.G.;Sagar, P.M.; Scofield, R.P.; Taylor, G.A. 2013: Conservation status of New Zealand birds, 2012. New Zealand Threat Classification Series4. Department of Conservation, Wellington. 22 p.Rowe, S.J. 2009: Conservation Services Programme observer report: 01 July 2004 to 30 June 2007. DOC Marine Conservation Services Series 1. Department of Conservation, Wellington. 93 p. Available for download at http://www.doc.govt.nz/mcsRowe, S. 2013: Level 1 risk assessment for incidental seabird mortality associated withfisheries in New Zealand’sExclusive Economic Zone. DOC Marine Conservation Services Series 10.Department of Conservation, Wellington.58 p.