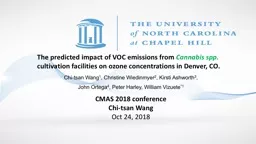
Wang Oct 24 2018 The predicted impact of VOC emissions from Cannabis spp cultivation facilities on ozone concentrations in Denver CO Chitsan Wang 1 Christine Wiedinmyer 2 Kirsti Ashworth ID: 725455
Download Presentation The PPT/PDF document "CMAS 2018 conference Chi-tsan" is the property of its rightful owner. Permission is granted to download and print the materials on this web site for personal, non-commercial use only, and to display it on your personal computer provided you do not modify the materials and that you retain all copyright notices contained in the materials. By downloading content from our website, you accept the terms of this agreement.
Slide1
CMAS 2018 conferenceChi-tsan WangOct 24, 2018
The predicted impact of VOC emissions from Cannabis spp. cultivation facilities on ozone concentrations in Denver, CO.
Chi-tsan
Wang
1
, Christine Wiedinmyer
2
, Kirsti Ashworth
3
,
John Ortega
4
, Peter Harley, William
Vizuete
*1Slide2
Cannabis industry status in the US and Colorado
2018 CDOR
2Slide3
Can Cannabis industry impact regional air quality?3
The biogenic VOC concentrations range are reported in the Cannabis Cultivational Facilities (CCF) (
Martyny
2013) :
Vegetative rooms is
50-100 ppb
Flower room:
800ppb
Trim room: 6ppm
(
Martyny
2013)
https://images1.westword.com/imager/u/original/9206625/den_011217_veritas_grow_slentz009.jpg
http://www.techtimes.com/articles/129956/20160202/this-is-what-happens-when-you-use-marijuana-every-day-for-five-years.htm
https://www.shutterstock.com/image-photo/commercial-marijuana-grow-operation-631014320?src=4fLy_muzSLGlLQDXBvVUBQ-1-7Slide4
The cannabis emission capacities (µ
gC g-1 hr-1 )
(Wang 2018 accepted)
The BVOC emission compositions are vary by different growth stages and different strains.
The
emission capacities EC
(µ
gC
g
-1
hr
-1
) for all terpenoids among the three strains is about 5-9 (µ
gC
g-1 hr
-1 )
4Slide5
5
Why the BVOC emissions from CCFs are important in Denver?
Moderate (2016)
Marginal (2015)
Moderate (2017)Slide6
The Western Air Quality Study (WAQS) modelThe 36km x 36km Western Air Quality Model Study (WAQS) and nested inner 12km x 12km domains (dark green) and 4km x 4km domains (light green) for the Comprehensive Air Quality Model with Extensions (CAMx).
Air Quality Model (WAQS2011b) This model was developed in 2017 and it’s the latest model for state implementation plan (SIP).
CAMx6.10, 90days(6/15~9/15)
, from Intermountain West Data Warehouse (IWDW)
Emission : 2011 NEI, MEGAN
Meteorological data: WRF
Chemical mechanism : CB6r2
Process Analysis was enabled
We can not compare the model result with monitoring data, because the model year is 2011 and the cannabis industry started in 2014.
6Slide7
The Cannabis emission estimate for the model:
7
What factors should be considered for emission estimate?
Emission factors and emission composition for flower plant (µ
gC
g
-1
hr
-1
)
Dry plant weight (g)
Cannabis strains
Plant counts for each facility
Ventilation rate (
scfm
) Operating condition: light, temperature, humidity.
The type of facilities and their locations.https://www.shutterstock.com/image-photo/commercial-marijuana-grow-operation-631014320?src=4fLy_muzSLGlLQDXBvVUBQ-1-7Slide8
Model study assumption for cannabis industry8
All Monoterpenes emissions from Marijuana are simplified to a single TERP species in the CB6r2 mechanism
.
We assumed the temperature is 30
º
C
and light energy is 1000
mol
m-2 s-1 , 24/7 at same condition. The emission rate is constant.We assumed all Biogenic VOCs from the plants are directly released into atmosphere, there are no chemical loss, wall loss and No emission control in CCF.Slide9
Ensemble Model scenarios setup
Scenario name
EC (
ug
/g/
hr
)
Dry biomass weight (g/plant)
Plant count in Retail MCF
Plant count in Medical MCF
BC
0
0
0
0
1_EC
10
1500
1800
3600
2_EC
50
1500
1800
3600
3_EC
100
1500
1800
3600
4_DW
50
750
1800
3600
5_DW
50
2500
1800
3600
6_PC
50
1500
1000
1000
7_PC
501500360060008_PC5015006000100009_MAX1002500600010000
9
The factors for each facility : Emission Capacities, Dry plant weight, Plant count
Terpene emission rate in each facility
= EC x Dry plant weight x plant countSlide10
How the cannabis industry emission rate affect the Biogenic VOC emission in Colorado and Denver?10
+0.15%
+1.2%
+14%Slide11
How the cannabis industry emission rate affect the Biogenic VOC emission in Colorado and Denver?
11
+90%
+154%
+224%
+447%
+745%
+781%
+894%
+1301%
+8500%
22458Slide12
8-hour ozone difference in 90days
12
Day time 8-hr ozone change : 0.1-6.4 ppb
Night time 8-hr ozone change : 0.3-8.7 ppbSlide13
Maximum hourly ozone difference in 90 days13Slide14
Case study for daytime and night time ozone 14
Case description
Date
DM8H in AQS
(ppb)
DM8H in model base case
(ppb)
Day time increase at 9AM(ppb)
Night time increase at 1AM (ppb)
Early morning increase at 6 AM (ppb)
Max daytime ozone increase
Jul 18
86
91.05
12.7
8.7
5.3
Max nighttime ozone increase
Jul 31
83
76.08
3.5
10.6
8.1
Early morning ozone increase
Aug 28
70
71.73
6.7
8.2
13.4Slide15
Conclusion:15Yes, the model prediction suggest that 0.13-6.4ppb impact on daytime 8 hour ozone.(one hour ozone impact is
0.3-13ppb)Lacking of data for plant count, emission rate data for different strains and dry plant weight. There is a lot of uncertainty in this model study. (Terpene emission range in Colorado is from 490 - 49000 ton/year)Daytime ozone increase is driven by the injection of Highly reactive VOC (terpene) emission in urban area.Nighttime terpene react with NO
3
, and generate more organic nitrate and RO
2
radicals. This additional terpene emission impact the NOx budget, and remove N
2
O5 at night. Slide16
Thank youAcknowledgement :NCAR Advanced Study Program(ASP) FellowshipIntermountain West Data Warehouse (IWDW)Advisor: Dr. William Vizuete
Dr. Christine WiedinmyerDr. Kirsti
Ashworth
Dr. Peter Harley
Dr. John Ortega
Dr. Jason Surratt
Dr. Michael
Barna
Dr. Feng-Chi Hsu(David Hsu)
Grant
Josenhans
16