/
Earthquakes: Increasing Over Time? Earthquakes: Increasing Over Time?

Earthquakes: Increasing Over Time? - PowerPoint Presentation

alida-meadow
alida-meadow . @alida-meadow
Follow
348 views
Uploaded On 2018-12-04

Earthquakes: Increasing Over Time? - PPT Presentation

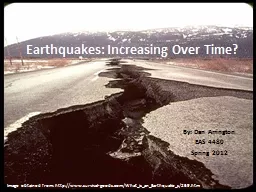
By Dan Arrington EAS 4480 Spring 2012 Image obtained from httpwwwsurvivalgoodscomWhatisanEarthquakes269htm Background Information Richter Scale Measures magnitude Energy released ID: 735138

earthquakes term http results term earthquakes results http long data short magnitude earthquake year damage squared major areas cont

Share:

Link:

Embed:

Download Presentation from below link

Download Presentation The PPT/PDF document "Earthquakes: Increasing Over Time?" is the property of its rightful owner. Permission is granted to download and print the materials on this web site for personal, non-commercial use only, and to display it on your personal computer provided you do not modify the materials and that you retain all copyright notices contained in the materials. By downloading content from our website, you accept the terms of this agreement.


Presentation Transcript

Slide1

Earthquakes: Increasing Over Time?

By: Dan Arrington

EAS 4480Spring 2012

Image obtained from: http://www.survival-goods.com/What_is_an_Earthquake_s/269.htmSlide2

Background InformationRichter Scale

Measures magnitudeEnergy released follows log scale:

log Es = 4.8 + 1.5Ms Es

is the energy

released in joules. Ms is the magnitude of the earthquake.

MagnitudeDescriptionEarthquake effectsFrequency of occurrenceLess than 2.0MicroMicro earthquakes, not felt.[14]Continual2.0–2.9MinorGenerally not felt, but recorded.1,300,000 per year (est.)3.0–3.9Often felt, but rarely causes damage.130,000 per year (est.)4.0–4.9LightNoticeable shaking of indoor items, rattling noises. Significant damage unlikely.13,000 per year (est.)5.0–5.9ModerateCan cause major damage to poorly constructed buildings over small regions. At most slight damage to well-designed buildings.1,319 per year6.0–6.9StrongCan be destructive in areas up to about 160 kilometres (99 mi) across in populated areas.134 per year7.0–7.9MajorCan cause serious damage over larger areas.15 per year8.0–8.9GreatCan cause serious damage in areas several hundred kilometres across.1 per year9.0–9.9Devastating in areas several thousand kilometres across.1 per 10 years (est.)10.0+MassiveNever recorded, widespread devastation across very large areas; see below for equivalent seismic energy yield.Extremely rare (Unknown/May not be possible)

Source: http

://

en.wikipedia.org/wiki/Richter_magnitude_scaleSlide3

Why is it important?Earthquakes can be deadly and cause widespread damage.

Source: http://disastersstrike.blogspot.com/2011/03/haiti-compared-to-japan.html

Haiti – Magnitude 7.0; 200,000+ Deaths

Japan – Magnitude 8.9; 10,000+ Deaths

Es

= 1.413 x 10

18 JEs = 1.995 x 10¹⁵ JSlide4

It’s About LocationThe San Andreas Fault Zone is well knownThe New Madrid Fault Zone is much larger

It would be a good idea to make some assessments. A few things to consider are:Awareness of geographic locationEnforcement of building codes

Implementing warning systems

Source: http://endoftheamericandream.com/archives/is-the-new-madrid-fault-earthquake-zone-coming-to-lifeSlide5

DataI looked at long term and short term data. I wanted to see if the numbers of earthquakes per year are increasing over time.The long term data spans a century, from 1900-1999. I compared the first half to the second half of the century.

The short term data compares 20 year increments, 1970-1989 and 1990-2009.Slide6

Long Term ProcedureFor the 100 years of data, I looked at major (7 to 7.9) to great (8+) earthquakes only. This is because before the 1930’s

the catalog is only complete down to magnitude 7.I plotted the data to look at trends. Then I did a least squares regression, reduced major axis regression, and principal component regression. I also calculated the correlation coefficient using the corrcoef

() function and bootstrap method.I also tested for normality of the residuals using the chi-squared test. If normal, I could apply the F-test to see if the data has equal variances. If equal, I could apply the Student’s t-test to see if the means of the data are equal.Slide7

Long Term Results

1943: 32 Magnitude 7+ Earthquakes 1960: 14 Magnitude 7+ EarthquakesSlide8

Long Term Results

(cont

.)pLSQ

= -0.1682

pRMAR

= -0.8066

pPCR = -0.4031Total Earthquakes, 1900-1949: 852Total Earthquakes, 1950-1999: 701 Slide9

Long Term Results (cont.)

Mean r

= -0.2090

Using

corrcoef

()r = -

0.2085p = 0.146295% Confidencerlow = -0.4601rhigh = 0.0742ResultInsignificantSmall CorrelationSlide10

Long Term Results (cont.)Chi-squared value: 14.9340Critical Chi-squared value: 14.0671

Data doesn’t follow a normal distribution.F-test can’t be appliedStudent’s t-test can’t be appliedSlide11

Short Term ProcedureI looked at major to great earthquakes and plotted the data. I did all of the same regressions here as I did for long term.

I calculated the correlation coefficient using the corrcoef() function and bootstrap method.

Finally, applied the Chi-Squared test to check for normality and see if other tests could be applied.Slide12

Short Term ResultsSlide13

Short Term Results (cont.)

pLSQ

= 0.1596

pRMAR

= 0.6793

pPCR = 0.2740

Total Earthquakes, 1970-1989: 261Total Earthquakes, 1990-2009: 297Slide14

Short Term Results (cont.)

Mean r

= 0.2150

Using

corrcoef

()r = 0.2349p = 0.3188

95% Confidencerlow = -0.2317rhigh = 0.6136ResultInsignificantSmall CorrelationSlide15

Short Term Results (cont.)Chi-Squared value: 8.1197

Critical Chi-Squared value: 14.0671F value: 2.1674Critical F value:

2.1683h 0% Significance for t: 0.092695% Confidence Interval:

[-3.9117 0.3117]Slide16

ConclusionsBased on the long term results, there is not an increasing trend in the number of major and great earthquakes per year.Based on the short term results, however, there seems to be an increasing trend.

Neither long term or short term results have a large correlation.I feel that the number of major and great earthquakes occurring each year follow a pattern, and trends can be found based on what time periods you compare.Slide17

Questions?Slide18

SourcesData Sources:http://earthquake.usgs.gov/research/data/centennial.php

http://www.johnstonsarchive.net/other/quake1.html Other Sources:http://en.wikipedia.org/wiki/Richter_magnitude_scale

http://earthquake.usgs.gov/learn/faq/?faqID=33 http://www.survival-goods.com/What_is_an_Earthquake_s/269.htm

http

://

disastersstrike.blogspot.com/2011/03/haiti-compared-to-japan.html http://endoftheamericandream.com/archives/is-the-new-madrid-fault-earthquake-zone-coming-to-life