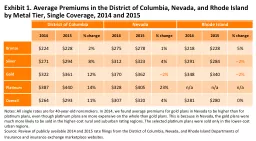
in the District of Columbia Nevada and Rhode Island by Metal Tier Single Coverage 2014 and 2015 District of Columbia Nevada Rhode Island 2014 2015 change 2014 2015 change ID: 493045
Download Presentation The PPT/PDF document "Exhibit 1. Average Premiums" is the property of its rightful owner. Permission is granted to download and print the materials on this web site for personal, non-commercial use only, and to display it on your personal computer provided you do not modify the materials and that you retain all copyright notices contained in the materials. By downloading content from our website, you accept the terms of this agreement.
Slide1
Exhibit 1. Average Premiums in the District of Columbia, Nevada, and Rhode Island by Metal Tier, Single Coverage, 2014 and 2015
District of ColumbiaNevadaRhode Island 20142015% change20142015% change20142015% changeBronze$224$2282%$275$2781%$218$2285%Silver$271$2948%$312$3234%$291$284–2%Gold$322$36112%$370$362–2%$348$340–2%Platinum$387$44014%$328$40523%n/an/an/aOverall$264$29311%$307$3204%$281$2800%
Notes: All single rates are for 40-year-old nonsmokers
. In 2014, we found average premiums for gold plans in Nevada to be higher than for platinum plans, even though platinum plans are more expensive on the whole than gold plans.
This
is
because in
Nevada,
the
gold plans were much more likely to be sold in the
higher-cost
rural and suburban rating regions. The selected platinum plans were
sold only in
the
lower-cost
urban regions
.
Source
: Review of
publicly
available 2014 and 2015 rate filings from the
District of Columbia, Nevada,
and
Rhode Island
Departments of Insurance and i
nsurance exchange marketplace
websites
.Slide2
Exhibit 2. Average Premiums in the District of Columbia, Nevada, and Rhode Island for Single, Couple, and Family Coverage, 2014 and 2015
District of ColumbiaNevadaRhode Island 20142015% change20142015% change20142015% changeSingle$264$29311%$307$3204%$281$2800%Couple$528$58511%$615$6394%$563$559–1%Family$882$97811%$912$9575%$845$837–1%Note: Single rates are for 40-year-old nonsmokers; couple rates are for two 40-year-old nonsmokers; family rates are for a family of four (two 40-year-old nonsmokers plus two children in the 0–20 age bracket).Source: Review of publicly available 2014 and 2015 rate filings from the District of Columbia, Nevada, and Rhode Island Departments of Insurance and insurance exchange marketplace websites.Slide3
Exhibit 3. Average Deductibles, Out-of-Pocket Limits, and Copayments in the District of Columbia, Nevada, and Rhode Island by Metal Tier, 2014–2015Note: All single rates are for 40-year-old nonsmokers.Source: Review of publicly available 2014 and 2015 rate filings from the D.C., Nev., and R.I. Depts. of Insurance and insurance exchange marketplace websites.
State and YearAll PlansCatastrophicBronzeSilverGoldPlatinumDist. Columbia 2014 Average deductible (plans with deductibles) $3,618 $6,350 $5,177 $2,655 $1,200n/a Average out-of pocket limit $5,534 $6,350 $6,318 $5,730 $4,929 $2,600 Average copayment, primary care visit $26 $20 $36
$
29
$
20
$
10
Dist. Columbia 2015 Average deductible (plans with deductibles) $3,162 $6,600 $5,175 $1,950 $1,100n/a Average out-of-pocket limit $5,390 $6,600 $6,325 $6,192 $4,460 $1,900 Average copayment, primary care visit $22n/a $29 $21 $19 $20Nevada 2014 Average deductible (plans with deductibles) $3,289 $6,290 $5,375 $2,671 $985 $300 Average out-of-pocket limit $5,932 $6,290 $6,306 $6,284 $5,473 $2,500 Average copayment, primary care visit $29 $40 $38 $34 $22 $7Nevada 2015 Average deductible (plans with deductibles) $3,070 $6,600 $5,378 $2,962 $657 $264 Average out-of-pocket limit $5,717 $6,450 $6,347 $6,111 $5,429 $3,400 Average copayment, primary care visit $28 $40 $40 $32 $18 $8Rhode Island 2014 Average deductible (plans with deductibles) $3,296 $6,350 $5,533 $2,900 $1,250n/a Average out-of-pocket limit $5,113 $6,350 $6,350 $5,425 $3,563n/a Average copayment, primary care visit $21 $25 $40 $17 $12n/aRhode Island 2015 Average deductible (plans with deductibles) $3,190 $6,600 $5,283 $2,771 $1,017n/a Average out-of-pocket limit $5,313 $6,650 $6,408 $5,700 $3,542n/a Average copayment, primary care visit $23 $25 $35 $23 $15n/aSlide4
Exhibit 4. Statewide Averages for Benchmark Plans in the District of Columbia, Nevada, and Rhode Island, 2014 and 2015 State averages
20142015Percent changeDistrict of Columbia$242$2535%Nevada$261$259–1%Rhode Island$294$260–12%Note: All single rates are for 40-year-old nonsmokers.Source: Review of publicly available 2014 and 2015 rate filings from the District of Columbia, Nevada, and Rhode Island Departments of Insurance and insurance exchange marketplace websites.