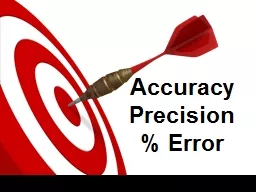
10 And what they teach us about flow Based on Phys Rev C 93 0449152016 amp PhysRev C94 0119012016 10 Contributions from Natasha Sharma Joel Mazer Meg Stuart Aram Bejnood Christine Nattrass ID: 760227
Download Presentation The PPT/PDF document "Precision measurements of jet-like corre..." is the property of its rightful owner. Permission is granted to download and print the materials on this web site for personal, non-commercial use only, and to display it on your personal computer provided you do not modify the materials and that you retain all copyright notices contained in the materials. By downloading content from our website, you accept the terms of this agreement.
Slide1
Precision measurements of jet-like correlations
And what they teach us about flow
Based on Phys. Rev. C 93, 044915(2016) & Phys.Rev. C94 011901(2016) Contributions from Natasha Sharma, Joel Mazer, Meg Stuart, Aram Bejnood
Christine Nattrass
Slide2Jets and flow
K, O’Hara, S. Hemmer, M. Gehm, S. Granade, J. Thomas
Science 298 2179 (2002)
p
p
a, x
a
b, x
b
σ
ab
c, x
c
d, x
d
D
D
Both lead to azimuthal correlations
Jets
→
background for flow
Flow
→
background for jets
p+p di-jet event in STAR
Slide3Overview
New method for separating jets from flow
Apply it to data
Di-hadron correlations
Jet-hadron correlations
And what we learn about flow from jet-like correlations
Slide4Methods
Slide5Two component model
Two component modelAssume contributions can be factorizedAlternately, define signal as anything which isn't consistent with separable flow and jet componentsAssumptions even embedded in studies of full jets
Jets
Flow
h-h
√
s
NN
= 2.76 TeV
30-40% PbPb
8<p
T
trigger
<10 GeV/c
1<p
T
assoc
<2 GeV/c
Slide6Zero Yield At Minimum
Flow component given by Fix background level at minimumUse independent measurements of vn
Jets
Flow
Slide7Issues with ZYAM
Tends to underestimate background levelCan use fixed point (e.g. Δφ=1) insteadvn for background may not be the same as independent measurementsCumulant methods suppress fluctuationsReaction plane measurements may include effects from jetsEvents with jets may be differentHigh and low pT reaction planes may be differentIf jet peak is broadened, may overestimate background (underestimate signal)
Jets
Flow
Slide8Background Subtraction Methods
Δη Method: Project near-side signal onto Δη and subtract constant background. Near-side onlyΔη Gap Method: Use signal at large Δη to determine background, assuming constant background in Δη. Near-side onlyZero-Yield at Minimum (ZYAM): Assumes vn from other studies, assumes region around Δφ≈1 is background dominatedNear-Side Fit (NSF): assumes small Δφ/large Δη region background dominated, fits vn and BReaction Plane Fit (RPF): assumes small Δφ/large Δη region background dominated, fits vn and B using reaction plane dependenceNear-Side Subtracted NSF/RPF (NSS NSF/RPF): fits vn and B at small small Δφ using reaction plane dependence after subtracting the near-side with a fit
Slide9Separating the signal and the background
Toy model:
Signal: PYTHIA
Background: thrown to v
n
= 10 to match data
Details in backup and paper
Slide10Signal vs background
Signal+background
Background dominated region
Signal only
h-h
√
s
NN
= 2.76 TeV
30-40% PbPb
8<p
T
trigger
<10 GeV/c
1<p
T
assoc
<2 GeV/c
Slide11Near-Side Fit (NSF) method No reaction plane dependence
Signal+background
Background dominated region
Fit
extrapolation
h-h
√
sNN = 2.76 TeV30-40% PbPb8<pTtrigger<10 GeV/c1<pTassoc<2 GeV/c
Project signal+background over 1.0<|Δη|<1.4Fit background in |Δφ|<π/2 with vn up to n=4
Slide12Near-Side Fit (NSF) method No reaction plane dependence
Reconstructs signal with less bias and smaller errors than ZYA1 method
Extract vn consistent with input
Standard ZYA1 = Zero Yield at ΔΦ=1Modified ZYA1 = Zero Yield at ΔΦ=1 for 1.0<|Δη|<1.4
h-h √sNN = 2.76 TeV30-40% PbPb8<pTtrigger<10 GeV/c1<pTassoc<2 GeV/c
Slide13Near-Side Fit (NSF) method
No reaction plane dependence
Signal+background
Background dominated region
Fit
extrapolation
h-h
√sNN = 2.76 TeV30-40% PbPb8<pTtrigger<10 GeV/c1<pTassoc<2 GeV/c
Project signal+background over 1.0<|
Δη|<1.4
Fit background in
|Δφ|<1
Not reliable over narrower Δφ region
Slide14Background Subtraction Methods
Δη Method: Project near-side signal onto Δη and subtract constant background. Near-side onlyΔη Gap Method: Use signal at large Δη to determine background, assuming constant background in Δη. Near-side onlyZero-Yield at Minimum (ZYAM): Assumes vn from other studies, assumes region around Δφ≈1 is background dominatedNear-Side Fit (NSF): assumes small Δφ/large Δη region background dominated, fits vn and BReaction Plane Fit (RPF): assumes small Δφ/large Δη region background dominated, fits vn and B using reaction plane dependenceNear-Side Subtracted NSF/RPF (NSS NSF/RPF): fits vn and B at small small Δφ using reaction plane dependence after subtracting the near-side with a fit
Slide15Adding reaction plane dependence
Slide16Background in correlations
All reaction plane angles When trigger is restricted relative to reaction planeBackground level modified Effective vn modified
Phys.Rev. C69 (2004) 021901
arXiv:nucl-ex/0311007
φS is the angular threshold
Slide17Reaction Plane Fit (RPF) method
30-40% central
Fit
Project signal+background over 1.0<|
Δη|<1.4
Fit background in |Δφ|<1 including reaction plane dependence
v
n
and B extracted with v
n
up to n=4
h-h
√
s
NN
= 2.76 TeV
30-40% PbPb
8<p
T
trigger
<10 GeV/c
1<p
T
assoc
<2 GeV/c
Slide18Reaction Plane Fit (RPF) method 30-40% central
h-h
√sNN = 2.76 TeV30-40% PbPb8<pTtrigger<10 GeV/c1<pTassoc<2 GeV/c
Slide19Background Subtraction Methods
Δη Method: Project near-side signal onto Δη and subtract constant background. Near-side onlyΔη Gap Method: Use signal at large Δη to determine background, assuming constant background in Δη. Near-side onlyZero-Yield at Minimum (ZYAM): Assumes vn from other studies, assumes region around Δφ≈1 is background dominatedNear-Side Fit (NSF): assumes small Δφ/large Δη region background dominated, fits vn and BReaction Plane Fit (RPF): assumes small Δφ/large Δη region background dominated, fits vn and B using reaction plane dependenceNear-Side Subtracted NSF/RPF (NSS NSF/RPF): fits vn and B at small small Δφ using reaction plane dependence after subtracting the near-side with a fit
Slide20Background Subtraction Methods
Δη
Method:
Project near-side signal onto
Δη and subtract constant background.
Near-side only
Δη
Gap
Method:
Use signal at large
Δη to determine background, assuming constant background in Δη.
Near-side only
Zero-Yield at Minimum (ZYAM):
Assumes v
n
from other studies, assumes region around
Δφ≈
1 is background dominated
Near-Side Fit (NSF):
assumes small
Δφ
/large
Δ
η
region background dominated, fits v
n
and B
Reaction Plane Fit (RPF):
assumes small
Δφ
/large
Δ
η
region background dominated, fits v
n
and B
using reaction plane dependence
Near-Side Subtracted NSF/RPF (NSS NSF/RPF):
fits v
n
and B at small small
Δφ
using reaction plane dependence
after subtracting the near-side with a fit
Slide21STAR data
Slide22STAR measurements of dihadron correlations relative to reaction plane
Correlations on arxiv (nucl-ex/1010.0690 v2)Published article (Phys. Rev. C 89 (2014) 41901) does not include raw correlationsZYAM background subtractionReports ridge at Δη> 0.7RPF method assumes no signal at Δη> 0.7
0.7<Δ
η<
2
Slide23Dihadron correlations
Phys. Rev. C 94, 011901(R) 2016
Phys.Rev.Lett.93:252301,2004
4.0<p
T
trig
<6.0 GeV/c
Slide24ALICE data
Joel Mazer: Hot Quarks 2016, Quark Matter 2017
Slide251.0-1.5 GeV/c
1) signal+bkgrd
2) bkgrd dominated
3) bkgrd RPF fit
Correlation function
Uncertainties dominated by statistics Background uncertainty is non-trivially correlated point-to-point
Slide261) signal+bkgrd
2) bkgrd dominated
3) bkgrd RPF fit
Correlation function
v3 and v4 components important Background uncertainty is non-trivially correlated point-to-point
1.5-2.0 GeV/c
Slide271) signal+bkgrd
2) bkgrd dominated
3) bkgrd RPF fit
Correlation function
Away side clearly there and suppressed
2.0-3.0 GeV/c
Slide281) signal+bkgrd
2) bkgrd dominated
3) bkgrd RPF fit
Correlation function
Background level negligible
4.0-5.0 GeV/c
Slide29What about flow?
Slide30vn from RPF method
Different vn from RPF method for h-h correlationsSame vn as inclusive studies from RPF for jet-h correlations
Slide31One of the following must be true:
v
n
jet
≠
v
n
bkgd
Dihadron correlations:
Background: J-B, B-J, B-B
Signal: J-J
Jet-hadron correlations: fake jets negligible
Background: J-B
Signal: J-J
Hard and soft rxn planes decorrelated
Soft rxn plane reconstructed
Reaction plane measurements may include effects from jets
Events with jets have different flow
Slide32Conclusions
RPF method is robustAllows studies of away sideMove beyond ZYAM.Precision correlation studies possibleNo more Mach cone!Jets exhibit little/no reaction plane dependenceSomething interesting is going on with flow
Conclusions
Slide33Toy model
Slide34Model for signal
Use PYTHIA Perugia 2011
π±, K±,`p, p for unidentified hadronsQuarks and gluons as proxy for reconstructed jets
h-h
√
s = 2.76 TeV
pp collisions
8<p
T
trigger
<10 GeV/c
1<p
T
assoc
<2 GeV/c
Slide35Model for background
True reaction plane angle is always at
φ
=0 in detector coordinates
Throw random reconstructed reaction plane angle
Assume Gaussian reaction plane resolution
Selected to approximate data
Use measured particle yields to calculate how many associated particles would be measured
Use measured v
n
to determine their anisotropy relative to the reaction plane
Throw associated particles matching distribution observed in data using v
n
up to n=10
Slide36Acceptance correction
Fixed acceptance cuts leads to a trivial structure due to acceptance
This is fixed with a “mixed event” correction
Throw random trigger, associated particle within acceptance
Calculate
Δφ, Δη
Use this distribution
to correct for
acceptance
Slide37Going to lower momenta
Slide38Low momenta
ZYAM assumptions break down at low pTIf method doesn't work on PYTHIA, it can't be trusted on data!But low pT is interesting!
h-h
√
s
NN
= 2.76 TeV
30-40% PbPb
8<p
T
trigger
<10 GeV/c
0.5<p
T
assoc
<1 GeV/c
Slide39Going to lower momenta, medium modifications
Peak gets broaderFit near-side peak and subtract itIncrease Δη range available for background subtraction
h-h,
√sNN = 2.76 TeV, 0-10% PbPb8<pTtrigger<10 GeV/c1<pTassoc<2 GeV/c for background, 0.5<pTassoc<1.0 GeV/c for signal
Before subtraction
After subtraction
Data/Fit
Structure from imperfect fit
Slide40Near-Side Subtracted RPF method
30-40% central
Fit
Project signal+background over
0.0
<|
Δη|<1.4
Fit background in |Δφ|<1 including reaction plane dependencevn and B extracted with vn up to n=4
h-h,
√
s
NN
= 2.76 TeV, 0-10% PbPb
8<p
T
trigger
<10 GeV/c
1<p
T
assoc
<2 GeV/c for background
0.5<p
T
assoc
<1.0 GeV/c for signal
Slide41Reaction Plane Fit (RPF) method
30-40% central
h-h
√sNN = 2.76 TeV30-40% PbPb8<pTtrigger<10 GeV/c1<pTassoc<2 GeV/c
Works beautifully!
h-h,
√
s
NN
= 2.76 TeV, 0-10% PbPb
8<p
T
trigger
<10 GeV/c
1<p
T
assoc
<2 GeV/c for background
0.5<p
T
assoc
<1.0 GeV/c for signal
Slide42Stages of a heavy ion collision
Jets
Flow
Slide43trigger
Phys Rev Lett 90, 082302
Jets – azimuthal correlations
p+p
dijet
Trigger
Associated
Select high momentum particles
→ biased towards jets
Slide44Azimuthal correlations
Phys.Rev.Lett.93:252301,2004
Slide45Competing effects
Quenching
Fewer jets, lower yield out of plane
Bremsstrahlung
Softer, higher yield out of plane
Fluctuations
Individual jets' energy loss may vary
Slide46Dihadron correlations
Phys. Rev. C 94, 011901(R) 2016
Slide47Near-side jet yields vs EP
Jets 20-40 GeV/c, 30-50% centrality
Competing effects
1) Quenching2) Bremsstrahlung3) etc
Within uncertainties ofcurrent statistics, no event plane orderingDifferent effects in different pT associated bins
Slide48Away-side jet yields vs EP
Jets 20-40 GeV/c, 30-50% centrality
Competing effects
1) Quenching2) Bremsstrahlung3) etc
Within uncertainties ofcurrent statistics, no event plane orderingDifferent effects in different pT associated bins
Slide49PYTHIA at 200 GeV
8<p
T
t
<10 GeV/c
Slide50PYTHIA at 200 GeV
3<p
Tt<4 GeV/c
4<p
T
t
<6 GeV/c
Slide51Near-Side Subtracted NSF method
Project signal+background over
0.0
<|Δη|<1.4Fit background in |Δφ|<1 including reaction plane dependenceBias from residual contamination by near-side
h-h,
√
s
NN
= 2.76 TeV, 0-10% PbPb
8<p
T
trigger
<10 GeV/c
1<p
T
assoc
<2 GeV/c for background
0.5<p
T
assoc
<1.0 GeV/c for signal
Slide52Correlations - STAR
Green: d+Au, Red: Au+Au
Large error bars
“
Mach Cone” evident, even decrease in amplitude for higher p
T
t
Background subtracted correlations 4<pTt<6 GeV/c
1.5<p
T
a<2.0 GeV/c
2.0<pTa<3.0 GeV/c
3.0<p
Ta<4.0 GeV/c
Yellow bands: uncertainty in rescaling of backgroundStatistical error bars include correlated statistical error on background
No “Mach Cone”
Slide54STAR
Slide55RPF Method
6 bins relative to reaction plane
Background level
Normalized per trigger
→
B same in all bins if v
2
t
is the only effect
→ reduces info for RPF
“
The background levels can be different for the different
φ
s
slices
because of the net effect of the variations in jet-quenching with
φ
s
and the centrality cuts in total charged particle multiplicity in the TPC within |
η
| < 0.5.” (Pg. 10, arxiv version)
→
Not consistent with ZYAM assumptions!
Used reaction plane resolution values from paper and their uncertainties
Used TPC for reaction plane and analysis – potential autocorrelations
Data available for Δη< 0.7 (signal+background) and 0.7<Δη< 2 (background dominated)
Acceptance correction in not applied
→ background must be scaled → uncertainty
Jet-like correlation not eliminated in 0.7<Δη< 2 for all p
T
t
, p
T
a
given in paper →
focus on high p
T
Slide56v2 STAR vs Fit
Centrality bin is 20-60% - proper weighting of average?Bias in event selection with high pT trigger?Bias in reconstructed reaction plane in the presence of a jet?Residual jet-like signal in background dominated region?Less information in fit due to normalization by Ntrigger?
v
2
STAR (Table I)
v
2
Fit (stat. errors only)
1.5<p
T
<2.0 GeV/c
0.164
± 0.011
0.194
± 0.008
2.0<p
T
<3.0 GeV/c
0.189
± 0.012
0.237
± 0.010
3.0<p
T
<4.0 GeV/c
0.194
± 0.013
0.293
± 0.058
4.0<p
T
<6.0 GeV/c
0.163
± 0.020
0.073
± 0.025
0.036 ± 0.033
0.033 ± 0.068
Slide57trigger
Phys Rev Lett 90, 082302
Jets – azimuthal correlations
p+p
dijet
Trigger
Associated
Select high momentum particles
→ biased towards jets
Slide58Azimuthal correlations
Phys.Rev.Lett.93:252301,2004
Slide59Dihadron correlations
Phys. Rev. C 94, 011901(R) 2016
4.0<p
T
trig
<6.0 GeV/c
Sharma, Mazer, Stuart, Nattrass:
(Phys. Rev. C 93, 044915 2016)
Phys.Rev.Lett.93:252301,2004
Slide60Dihadron correlations
Phys. Rev. C 94, 011901(R) 2016
Slide611) signal+bkgrd
2) bkgrd dominated
3) bkgrd RPF fit
Correlation function
Away side clearly there and suppressed
2.0-3.0 GeV/c
Joel Mazer
Hot Quarks 2016
Slide62Away-side jet yields vs EP
Jets 20-40 GeV/c, 30-50% centrality
Competing effects
1) Quenching2) Bremsstrahlung3) etc
Within uncertainties ofcurrent statistics, no event plane orderingDifferent effects in different pT associated bins
Joel Mazer
Hot Quarks 2016
Slide63Little/no path length dependence?
Path length dependence naively predicted by every model
No path length dependence seen in rxn plane dependent A
j
either
Insufficient sensitivity?
Statistical variation in energy loss is more important than path length dependence
J. G. Milhano and K. C. Zapp, “Origins of the di-jet asymmetry in heavy ion collisions,” arXiv:1512.08107
F. Senzel, O. Fochler, J. Uphoff, Z. Xu, and C. Greiner, “Influence of multiple in-medium scattering processes on the momentum imbalance of reconstructed di-jets,” J. Phys. G42 no. 11, (2015) 115104, arXiv:1309.1657 [hep-ph].
Slide64http://www.boredpanda.com/animal-camouflage/
Slide65http://www.boredpanda.com/animal-camouflage/
Bias
Modified jets probably look more like the medium
Quark jets are narrower, have fewer tracks, fragment harder [Z Phys C 68, 179-201 (1995), Z Phys C 70, 179-196 (1996), ]
Gluon jets reconstructed with k
T
algorithm have more particles than jets reconstructed with anti-k
T
algorithm [Phys. Rev. D 45, 1448 (1992)]
Gluon jets fragment into more baryons [EPJC 8, 241-254, 1998]