/
PRESS ANNOUNCEMENT PRESS ANNOUNCEMENT

PRESS ANNOUNCEMENT - PDF document

alida-meadow
alida-meadow . @alida-meadow
Follow
375 views
Uploaded On 2016-08-25

PRESS ANNOUNCEMENT - PPT Presentation

GAMES WORKSHOP GROUP PLC 2 8 July 201 5 ANNUAL REPORT 
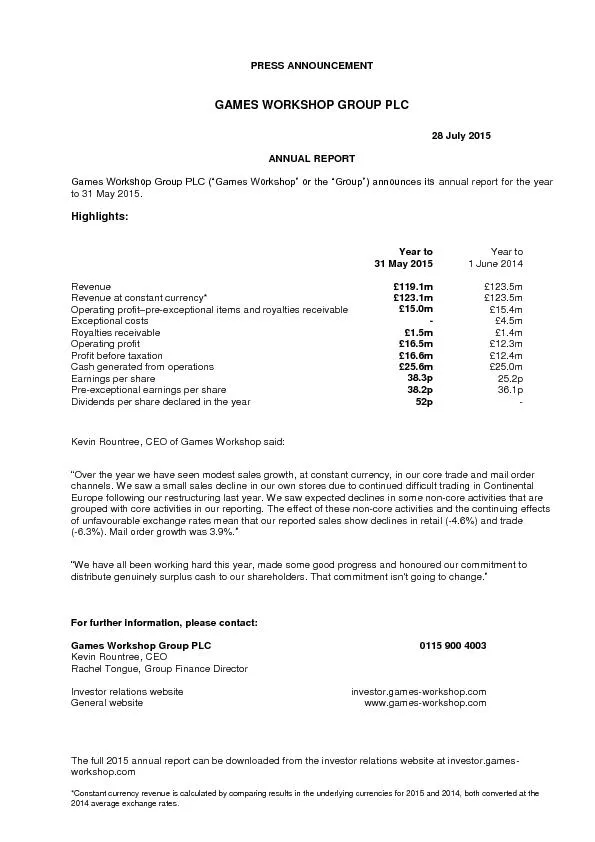
Games Workshop Group PLC x201CGames Workshopx201D or the x201CGroupx201D announces its annual report for the year to 31 May 201 5 ID: 456453

GAMES WORKSHOP GROUP PLC 2 8 July 201 5 ANNUAL REPORT Games Workshop

Share:

Link:

Embed:

Download Presentation from below link

Download Pdf The PPT/PDF document "PRESS ANNOUNCEMENT" is the property of its rightful owner. Permission is granted to download and print the materials on this web site for personal, non-commercial use only, and to display it on your personal computer provided you do not modify the materials and that you retain all copyright notices contained in the materials. By downloading content from our website, you accept the terms of this agreement.


Presentation Transcript

PRESS ANNOUNCEMENT GAMES WORKSHOP GROUP PLC 2 8 July 201 5 ANNUAL REPORT Games Workshop Group PLC (“Games Workshop” or the “Group”) announces its annual report for the year to 31 May 201 5 . Highlights: Year to Year to 3 1 May 201 5 1 June 201 4 Revenue £ 119.1 m £ 1 23.5 m Revenue at constant currency* £ 123.1 m £1 23.5 m Operating profit – pre - exceptional items and royalties receivable Exceptional costs £ 1 5.0 m - £ 15.4 m £4.5m Royalties receivable £ 1.5 m £1. 4 m Operating profit £ 16.5 m £ 12.3 m Profit before taxation £ 16.6 m £ 12.4 m Cash generated from operations £ 25.6 m £25.0 m E arnings per share 38.3 p 25.2 p Pre - exceptional earnings per share Dividend s per share declared in the year 38.2 p 52p 36.1 p - Kevin Rountree, CEO of Games Workshop sa id: “ Over the year we have seen modest sales growth, at constant currency, in our core trade and mail order channels. We saw a small sales decline in our own stores due to continued difficult trading in Continental Europe following our restructuring last year. We s aw expected declines in some non - core activities that are grouped with core activities in our reporting. The effect of these non - core activities and the continuing effects of unfavourable exchange rates mean that our reported sales show declines in retail ( - 4.6 %) and trade ( - 6.3%). Mail order growth was 3.9%. ” “ We have all been working hard this year, made some good progress and honoured our commitment to distribute genuinely surplus cash to our shareholders. That commitment isn't going to change. ” For further information, please contact: Games Workshop Group PLC 0115 900 400 3 Kevin Rountree, CEO Rachel Tongue, Group Finance Director Investor relations website investor.games - workshop.com General website www.games - workshop.com The full 201 5 annual report can be downloaded from the investor relations website at investor.games - workshop.com *Constant currency revenue is calculated by comparing results in th e underlying currencies for 201 5 and 201 4 , both converted at the 2014 average exchange rates . STRATEGIC REPORT Strategy and objectives Games Workshop's ambitions remain clear: to make the best fantasy miniatures in the world and sell them globally at a profit, and it intends doing so forever. All of our decision making is focused on the long term success of Games Workshop , not short term gains. This statement includes all the key elements of what we do and why we do it that way. Before I go into what each key element is I'd like to share a thought. I believe we are a unique business and I understand that some people find us and our product a little odd and possibly a little quirky too. We are both of these and we are proud of it . I also know I am CEO of one of the most exciting companies creating fun on the planet. We forget most days because we are all focused on delivering our jobs. Our Hobby is great fun. We really do intend to be around forever , creating fun. The first element - we make high quality miniatures. We understand that what we make is not for everyone, so to r ecruit and re - recruit customers we are absolutely focused on making our models the best in the world. In order to continue to do that forever and to deliver a decent return to our owners, we sell them for the price that we believe the investment in quality is worth. Our customers tend to be teenage boys and male adults with some spare money to spend and time to enjoy hobbies. I'd like to think our Hobby - modellin g, painting, collecting, gaming - is for an yon e. Our customers are found everywhere. O ur job is to, on a day to day basis, find them, commercially, wherever they are. The second element is that we make fantasy miniatures based in our imaginary worlds. This gives us complete control over the imagery a nd styles we use and complete ownership of the intellectual property. Aside from our core business, we are constantly looking to grow our royalty income from opportunities to use our IP in other markets. The third element is the global nature of our busin ess. W e seek out our customers all over the world. We believe that our customers carry our Hobby gene and to find them we apply our tried and tested approach of recruiting customers in our own stores, by offering a fantastic customer experience. Our retail business is supported by our own mail order store (it has the full range of our product) and our independent stockist accounts and trade outlets across the world. The independent accounts do a great job supporting our customers in parts of the world where we either have not opened one of our stores or where it is not commercially viable for us to have one of our stores. We will always have more independent accounts than our own stores. Our strategy is to grow our business through geographic spread growing all of the three complementary channels . The fourth element is being focused on cash. We want to deliver a great cash return every year so that we can continue to innovate , surprise and delight our loyal existing customers and new customers with great pro duct. To be around forever we also need to invest in both long term capital and short term maintenance projects every year, pay our staff what they have earned for the value they contribute and deliver surplus cash to our shareholders. Our complete dedicat ion and focus should ensure we deliver on time and within our agreed cash limits. We measure our success by seeking a high return on investments. In the short term , we will measure our success on our ability to grow sales whilst maintaining our core busi ness operating profit margin. The way we go about implementing this strategy is to recruit the best staff we can by looking for the appropriate attitudes and behaviour each job we do requires and identifying the value that job brings. It is also important that everyone we employ has a real desire to learn and has a great attitude to change. Our Academy offers all of our staff both personal development and management skills trainin g. It is also worth noting it's not what you know at Games Workshop , it's how much you contribute to our success , that we value. W e continue to believe there are great opportunities for further growth, particularly in North America and Northern Europe. So, we intend to keep on growing steadily; if we rush there is always a risk we will compromise one of the above. Business model and structure We design, manufacture, distribute and sell our fantasy miniatures and related products. These are fantasy miniatures from ou r own Warhammer 40,000 and Warhammer universes. Our factory, main distribution centre and back office support functions are all based in Nottingham. We are an international business centrally run from our HQ in Nottingham , with 72 % of our sales coming from outside the UK. Design Employing 167 people, the design studio in Nottingham creates all the miniatures, artwork, games and publications that we sel l. In 2014/15 we invested £7.7 million in the studio (including software costs) with a further £2.0 million spent on tooling for ne w plastic miniatures. We are committed to a similar level of investment every year. Manufacture We are proud to manufacture our product in Nottingham. It's where we started and where we intend to stay. During the year we have been planning a project to up grade our core IT systems that interface with our manufacturing equipment and systems. Distribute All of our product is initially distributed from our warehouse facility in Nottingham. This facility supplies our two hubs in Memphis, Tennessee and Sydney, Australia and either directly to our trade accounts and retail stores or via a third party carrier. During the year we started a project to upgrade the IT infrastructure and software for the warehouse that supports our mail order store based in Nottingham. Sell We sell via three channels, our own stores ‘Retail’, third party independent retailers ‘Trade’ and our ‘Mail order’ web store . Games Workshop stores - Retail - they provide the focus for the Hobby in their areas. They only stock Games Workshop product. They are where we recruit the majority of our new customers. To do so the stores don't offer the full range of our products, they are merchandised to offer all customers new release product and the appropriate extended range. To achieve this we ce ntrally run automatic stock replenishment from Nottingham. At the year end we had 418 Games Workshop stores in 20 countries. Our stores contributed 42% of the year's sales. Over the last five years we have been focusing on ensuring all of our stores are pr ofitable by exiting expensive locations and converting our stores to one man stores. We believe that this project is in effect complete : w e have 324 one man stores, small sites, each one staffed by only one store manager. We also have 94 multi man stores, which are constantly reviewed to ensure they remain profitable. If not , they will be closed and replaced with one man stores. Trade - we sell to third party retailers under closely controlled terms and conditions. They help us sell our products mostly whe re we don't have our own stores. The bulk of these sales are made via our telesales teams based in Memphis and Nottingham. We also have small teams in Sydney, Tokyo and Shanghai. Last year we had 3,700 independent retailers in 52 countries. We have success fully introduced over the last few year s a stockist programme which is designed to sell the right amount of stock into every account in line with their store format and performance. This programme is reviewed annually. The intention is that we stock all of our stockist accounts with our best sellers. We strive to deliver excellent service, operating in 16 languages covering all time zones. 37% of our sales came from sales to independent retailers in the year reported. Mail order - the mail order store allo ws enthusiasts full access to all Games Workshop products. It is run centrally from Nottingham. It accounted for 21% of total sales in 2014/15. All of our sto res have a terminal that allows our retail customers access to the full range. Structure We contr ol the business centrally from Nottingham; it is where the people with experience and knowledge of running our niche business work. I have put in place a flat structure: the people with senior responsibility report directly to me. My team is split int o thr ee parts: Sales, Operations and Advisers. My channel sales structure comprises retail, trade and mail order. This structure is made up of three key territory retail sa les managers in the UK, North America and Continental Europe and a global trade manager. These four individuals have been in their jobs now for just over 18 months and their progress is encouraging. Since taking up the position of CEO I have appointed a new global mail order manager, a new global digital sales manager, and a retail sales mana ger for Australia and N ew Z ealand . I also have a sales manager for Asia. My operations and support structure includes a new finance director for Games Workshop who is responsible for accounts, compl iance and legal duties. I have a product and supply manager who is responsible for our factory, logistics and design studios (Citad el, Forge World and Black Library). He also manages our three main distribution hubs in Nottingham, Memphis and Sydney. A personnel manager and our Academy personal development and skills training ensure we take our people recruitment and development serio usly. All of our senior managers attend management skills training, as a team, three times per year. My advisers comprise a small team who advise me with regard to any aspect of the use of our IP, licensing and product strateg y. To help me stay focused o n executing my key day to day duties I have arranged a consultancy agreement with Tom Kirby to support me with our Academy programme and our expansion in Asia. Key performance indicators The board and management team use a number of key performance indic ators to provide a consistent method of analysing performance, in addition to allowing the board to benchmark performance against our forecast. The key performance indicators utilised by the board can be split into key financial performance indicators and key non - financial performance indicators. The key financial performance indicators are: Moving Annual Total ( ‘ MAT ’ ) sales growth by channel Measures the sales growth achieved in each of our channels on a rolling 12 month basis. MAT Group gross margin Measures the gross profit achieved on sales after taking account of the direct costs and depreciation of manufacturing and sh ipping our product to customers/stores on a rolling 12 month basis. MAT c ore business profit Measures gross profit less operating expenses on a 12 month rolling basis, before royalty income. MAT number of own stores by territory Measures the number of our own stores on a rolling 12 month basis. This is an indicator of our global reach. MAT number of ordering stockist accounts by te rritory Measures the number of trade outlets that have ordered from us in the last three months. It is an indicator of our global rea ch and the health of our trade account base. The key non - financial indicators are: Product quality This is an indicator of the effectiveness of our design studio and our continuous improvement in design to manufacture. We measure this by looking at sell through. If the product is great we sell a lot, if not we sell very few. Outstanding customer service This is an indicato r of the effectiveness and efficiency of the service experience customers get in our stores and the time it takes us to resolve a customer query made to our customer service teams. The former is measured by the number of complaints I receive - very few - a nd the latter is tracked by five micro KPIs. Our approach is that ‘the customer is always right’ and we do our utmost to reso lve successfully any issues. Shareholder value We believe shareholder value is created, primarily, by not destroying it. We have no intention to acquire other companies, nor to dispose of any of those we own. We return our surplus cash to our owners and try to do so in ever increasing amounts. Revi ew of the year Over the year we have seen modest sales growth, at constant currency, in our core trade and mail order channels. We saw a small sales decline in our own stores due to continued difficult trading in Continental Europe following our restructuring last year. We saw expected declines in some non - core activities (described below) that are grouped with core activities in our reporting. The effect of these non - core activities and the continuing effects of unfavourable exchange rates mean t hat our reported sales show declines in retail ( - 4.6 %) and trade ( - 6.3%). Mail order growth was 3.9%. It is encouraging to see that the channels and territories not impacted by our restructuring last year delivered sales growth, namely, mail order, trade i n North America , Australia and New Zealand and retail in the UK, Australia and New Zealand . The restructuring across Continental Europe was delivered on time, within budget and has delivered the cost savings tha t were planned. We anticipated - correctly - that it would take some time to get this region back to its normal levels as we knew we would have to recruit a new trade team of recruiters and account developers in Nottingham servicing all of Continental Europe in the local languages. In the second ha lf that new team delivered sales growth of 1%. The impact in retail has taken a little longer than planned to recover. The key issue is store manager recruitment, which remains a key priority. The exit of loss making stores in Nor th America has been a chal lenge ; w e closed nine stores in the year and as a direct result have not delivered a net increase in stores in North America in the year. This project is now complete and, subject to finding the right managers, we will be embarking on a store opening progr amme in North America in 2015/16. We expected a decline in non - core t rade activities ( - £2.2 million) and this comprised export, non - strategic accounts and magazine sales via newsstand . The decline of non - core r etail of £0.7 million is due to the redevelopment of the visitor centre in Nottingham . We aim to offset this sales decline in 2015/16 with the opening of our new visitor centre and our new events programme. We are all very proud of the new venue, which opened on time and on bu dget in May 2015. It is a great example of our staff working together to deliver a project successfully. Gross margin declined in the period due to a decline in sales volumes and increased development costs due to the release of more new products . The qua lity of new product we release continues to surprise and delight our customers and we plan to do so every week. We have increased the prices of our new releases to reflect the additional investment and value we have built into these new releases. The annua l impact of this increase on our UK RRP price list is an average increase of 3%. Costs have been reduced in the year, mainly as a result of the savings delivered from restructuring in Continental Europe, the exit of high cost stores in North America and t he way in which we maintain cover staff for our UK stores. I have set a goal of getting the business into sales growth in 2015/16 and have asked staff to accept a salary freeze until December 2015 to allow us to maintain our cost to sales ratio. If we del iver sales growth in the first half of 2015/16 I have agreed to back date any salary reviews to 1 June 2015. We are all working hard to deliver this goal. Warhammer branding We have taken the decision in the year to rebrand our stores ‘Warhammer’. It is w hat our customers call us. This will be rolled out progressively, as and when we open new or refurbish our existing stores. At the year end date we had 13 Warhammer branded sto res. Product In July 2015, we relaunched Warhammer Fantasy to broad acclaim ‘Warhammer: Age of Sigmar’. We are so proud of this new range of miniatures that we have commissioned an additional statue at our HQ to complement our Space Marine, which has delighted our customers and staff for the last 17 years. You have to see it to be lieve it, you will not be disappointed. Licensing In the period we signed 17 new deals and have 44 contracts currently in place to produce more than 50 interactive products . Reported income is split: 52% traditional PC games, 27% mobile and 21% card, boar d and role - playing game licences. 37 new products were released in the period. We also announced a major tie up with SEGA to develop a real time strategy game ‘Total War: Warhammer’. Projects We have three major projects being implemented currently:  European ERP - enterprise resource plan ning (core back office systems) - replacement. It is estimated to cost £6.4 million.  Forge World mail order store. To protect our sales we are building a new Forge World mail order store on the same platform and hosti ng environment as our Citadel mail order store and migrating all products and imagery. It is on track with a scheduled go live date in the summer of 2015. It will cost £1.1 million.  Mail order warehouse system replacement. It is estimated to cost £0.8 mill ion. Return on capital* Our key measure of our performance is return on capital. During the year our return on capital fell from 42% to 40%. This was driven by both a decline in operating profit and an increase in capital employed. Sales Reported sales fell by 3.5 % to £119.1 million for the year. On a constant currency basis, sales were down by 0.3% from £123.5 million to £123.1 million; split by channel this comprised : retail £50.8 million (2014: £52.0 million), trade £46.2 million (2014: £46.9 million) and mail order £26.1 million (2014: £24.6 million). Operating profit Core business operating profit (operating profit bef ore royalty income) fell by £0.4 million to £1 5.0 million (2014: £15. 4 million). On a constant currency basis, core business operating profit increased by £2.2 million to £17.5 million. This was driven by a reduction in operating expenses excluding exceptional items. Operating expenses (excluding exceptional items) fell by £4. 2 million ; £1.8 million due to a reduction in retail store costs and s avings of £2.4 million from the restr ucture of Continental Europe have been realised. Costs remain a key area of focus. Capital employed Average capital employed* increased by £ 2 .0 million to £38.6 million. The book value of tangible and intangible assets increased by £1.3 million whilst trade and other receivables de creased by £0.2 million , inventories fell by £0.4 million and current liabilities fell by £1.3 million. Cash gene ration During the year, the Group’s core operating activities generated £20.3 million of cash after tax payments (2014: £17.9 million). The Group also received cash of £3.0 million in respect of royalties in the year (2014: £2.4 million). After purchases o f tangible and intangible assets and product development costs of £12.4 million (2014: £11.7 million) and d ividends of £16.6 million (2014 : £5.1 million) there were net funds at the year end of £12.6 million (2014: £17.6 million). Investments in assets T his is what we have been spending your money on: 2015 2014 £million £million Shop fits for new and existing stores 0.8 1.1 Production equipment and tooling 3 . 0 2. 8 Computer equipment and software 1.6 2.7 Lenton site including the new visitor centre 2.4 0.5 Total capital additions 7. 8 7. 1 In 2014/15 w e invested £0.8 million in shop fits: 34 new stores and three refurbishments. We also invested £3.0 million in tooling, milling and injection moulding machines. C apital investment is expected to be higher than depreciation and amortisation over the next few years as we upgrade our core back office systems in Nottingham. Dividends We followed our principle of returning truly surplus cash to shareholders . Dividends of 52 pence per share were paid during the year (£16.6 million; 2014: £5.1 million). Royalty income Royalty income increased in the period by £0.1 million to £1.5 million. Taxation The tax rate for the year was 26.1% (2014: 32.0%). We conti nue to expect a rate above that for business activities based solely in the UK, due to higher overseas tax rates. Sales by channel 42% (2014: 42%) of sales were made through our own stores, 37% (2014: 38%) of sales were to independent retailers and 21% (2014: 20%) mail order. Retail Store openings and closures during the year Number of stores at May 20 14 Opened Closed Number of stores at May 20 15 Number of one man stores at May 20 15 Number of one man stores at May 20 14 UK 142 10 (10 ) 142 108 103 North America 87 6 (9 ) 84 72 63 Europe 141 10 (6 ) 145 105 99 Australia 40 7 (4 ) 43 36 29 Asia 4 1 (1) 4 3 3 414 34 (30 ) 418 324 297 We relocated 15 stores and these are included in the opened/closed movement above. Our ability to open new stores is still (and always will be) limited by our ability to find the right people to run them. Although we are getting better at it, it is still our number one priority. Retail s ales fell by 4.6 % in the year ( - 2.2 % at constant currency), partially due to the continental european reorganisation as well as a decline in non - core retail sales relating to the refurbishment of the visitor centre in Nottingham. Trade Sales fell by 6.3 % in the year ( - 1. 6 % at constant currency) , partially due to the continen tal european reorganisation and decline in non - core trade sales. Mail order Our new online shop was launched in April 2014 and our online sales in the period were 3.9% higher than the prior year ( + 5.9 % at constant c urrency) . Treasury The objective of our treasury operation is the cost effective management of financial risk. The relationship with the Group’s bank is managed centrally. It operates within a range of board approved policies. No transactions of a specula tive nature are permitted. Funding and liquidity risk The Group pays for its operations entirely from our cash flow. We had a small facility at the bank which expired in December 2014. Interest rate risk Net interest receivable for the year (excluding net foreign exchange gains and unwinding of discounts on provisions) was £109 ,000 (2014: £106,000). Foreign exchange Our big currency exposures are the euro and US dollar: euro US dollar 2015 2014 2015 2014 Year end rate used for the balance sheet 1.39 1.23 1.53 1.68 Average rate used for earnings 1.31 1.20 1.58 1.62 The net impact in the year of exchange rate fluctuations on our operati ng profit was a reduction of £ 2.5 million (2014: reduction of £1.3 million). Priorities for next year As part of our overall strategy, four key strategic initiatives will be prioritised in 2015/16 . These are designed to deliver sales growth whilst maintaining our gross margin and keeping our costs flat. Firstly, staff recruitment. We need a constant stream of new people to join Games Workshop across all departments and over the last three years our Academy team has been training us all on how to find people whose personal qualities fit the jobs we need to fill. This ha s radically changed how we recruit and also how we performance manage ; to date our new approach has proven to be successful. The challenge now is how do we deal with our recruitment process on an industrial scale: globally we recruit hundreds of peop le eve ry year and our rigorous approach means that to do this successfully we need to consider thousands of application letters. To he lp us in this process I will be adding an expert in recruitment to my management team. This appointment should help ensure Games Workshop has the right processes in place to recruit the people we need when we need them to deliver our growth. Secondly , I will review our product range . W e believe this is long overdue : i t is time for a resetting of the ranges. Not tweaking here and there but a top down reassessment. I expect to update you further at the half year. We will aim to continue to deliver outstanding product and customer service, maintain our Group gross margin and continue to improve our Group stock turn. To be absolutely clear I will not be reducing the RRP of our products: they are premium priced for their premium quality. I will, however, be looking to offer a broader range of price points. This is exciting and is for the long term, so I'm not promising when you will see a change. We have already started the brainstorming in our monthly strategic product meetings. It is early days, but I can already foresee some busy times ahead. Thirdly, we must grow the number of customers we have. We have been underperforming here in recent years, mainly on account of our focus on the value based initiatives of converting our loss making stores to profitable ones and restructuring our sales businesses to take out duplicate and unnecessary costs. My aim is to: 1. Open more of our own stores, mostly in our proven one man store format , in greenfield cities in North America and Continental Europe. Our retail sales managers all have ambitious goals for 2015/ 16. I am also working closely with our manager for Asia to open more stores in Japan, Singapore and Hong Kong. We do believe we can establish our Hobby business in Asia, but this isn't going to happen overnight. My global goal is to open 30 stores (net) in 2015/16. If we achieve our first initiative it may well be man y more. I'm als o proposing a trial in a few high footfall locations , like the one we opened in April 2015 on Tottenham Court Road, London. It is a multi - man format store with an extended (more expensive) shop fit: mainly new till format, mobile tills, better use of merch andising space, new web terminal (to access our broader range) and next day stock delivery to the store for in - store orders. The store has been branded ‘Warhammer’ instead of ‘Games Workshop’. I believe that this store format can support the additional inv estment as such stores are uniquely placed to service a higher number of customers, often lots of tourists. My aim is to pilot, on a smaller scale, one each in Boston , Sydney, Munich, Paris and Copenhagen in the year ahead. I don't intend to move our overa ll retail strategy away from one man stores; these will be exceptional stores. The only differences to our one man store format will be the additional rent and property related costs and the additional capital investment. We can flex the staffing levels. 2. Open more stockist trade accounts using our proven stockist strategy. This will be based on our well established terms and conditions, selling independent accounts our best selling products and, where appropriate, the extended range. Our global tra de ma nager has some ambitious plans to grow the net number of trade outlets we have, with a part icular focus on North America. 3. Explore new core trade opportunities in toy, craft, book and comic stores. This has always been a great opportunity to ext end our reach and help us find new customers. I am working closely with my advisers exploring these types of locations. Finally, we will be replacing the European ERP system in Nottingham that we have been using for over 15 years: it has come to the end of its u seful life. This project will give us the opportunity to drive synergies throughout our back office functions by removing com plexity, re - engineering our processes and delivering our services at a lower cost. Following a lengthy and robust process we have n ow chosen the product and the vendor. As a result our capital investment is likely to be hi gher over the next few years . The total cost of this project , including internal resources, is estimated to be £6.4 million. Risks and uncertainties The board has overall responsibility for ensuring risk is appropriately managed across the Group. The top five risks to the Group are reviewed at each board meeting. The risks are rated as to their business impact and their likelihood of occurring. In addition, the Group has a disaster recovery plan to ensure ongoing operations are maintained in all circumstances. The princ iple risks identified in 2014/ 15 are discussed below. These risks are not intended to be an extensive analysis of all risks that may arise but mor e importantly the ones that would cause business interruption in the year ahead. ERP change – as discussed above we are changing our core ERP system in the UK. This is a complicated project with the risk of widespread business disruption if it is not impl emented well. Store manager recruitment – this comprises both recruitment of managers for new stores as well as replacing poor performing managers. Retail is our primary method of recruiting new customers and so we need great managers in all our stores. Su pply chain – as discussed above we are currently changing our mail order warehouse system. This is part of an ongoing programme of continuous improvement for these warehouse systems. As with any system change there are risks associated with the transition. Range management – as discussed above we are reviewing our range to ensure that we are exploring all opportunities. The risk is that we don’t fully exploit all the opportunities that are available to us. Distractions – this is anything else that gets in t he way of us delivering our goals. In my opinion the greatest risk is the same one that we repeat each year, namely, management. So long as we have great people we will be fine. Problems will arise if the board allows egos and private agendas to rule. I w ill do my utmost to ensure that this does not happen on my watch. Summary We have all been working hard this year, made some good progress and honoured our commitment to distribute genuinely surplus cash to our shareholders. That commitment isn't going t o change. Since being appointed CEO, I believe I have hit the ground running and not dropped too many balls. I am delighted that my team has responded well to the new CEO. We are working well together, are looking very lively - and with the launch of Warh ammer: Age of Sigmar having some fun too. We are confident we can achieve the priorities I have set for 2015/16. I will keep you appropriately informed. The board continues to believe that the prospects for the business are good. Kevin Rountree CEO 27 July 2015 Statement of directors’ responsibilities The directors confirm that this condensed consolidated financial information has been prepared in accordance with IFRSs and t hat the management report herein includes a fair review of the information required by DTR 4.2.7 and DTR 4.2.8, namely:  an indication of important events that have occurred during the year and their impact on the condensed set of financial statements, and a description of the principal risks and uncertainties; and  material rela ted - party transactions in the year and any material changes in the related - party transactions described in the last annual report. A list of all current directors is maintained on the investor relations website at investor.games - workshop.com . By order of the board Kevin Rountree CEO 27 July 2015 Rachel Tongue Group Finance Director 2 7 July 201 5 *We use average capital employed to take account of the significant fluctuation in working capital which occurs as the busine ss builds both inventories and trade receivables in the pre - Christmas trading period. Return is defined as pre - exceptional operatin g profit before royalty income, and the average capital employed is adjusted by deducting assets and adding back liabilities in respect of ca sh, borrowings, exceptional provisions, deferred royalty income, taxation and dividends. CONSOLIDATED INCOME ST ATEMENT Pre - exceptional Exceptional items items Total Year ended 31 May 2015 Year ended 1 June 2014 Year ended 1 June 2014 Year ended 1 June 2014 Notes £000 £000 £000 £000 Revenue 2 119,132 123,501 - 123,501 Cost of sales (36,988) (36,766 ) - (36,766) ---------- ---------- --------- ---------- Gross profit 82,144 86,735 - 86,735 Operating expenses (67,207) (71,380 ) - (7 1 , 3 80) Other operating income – royalties receivable 1,498 1, 442 - 1,442 Exceptional items 3 42 - (4,500) (4,500) ---------- ---------- --------- ---------- Operating profit 2 16,477 16,797 (4,500) 12,297 Finance income 109 106 - 106 Finance costs (1) (7) - (7) ---------- ---------- --------- ---------- Profit before taxation 16,585 16,896 (4,500) 12,396 Income tax expense 5 (4,328) (5,409 ) 1,020 (4,389) ---------- ---------- ---------- ---------- Profit attributable to owners of the parent 1 2,257 11,487 (3,480) 8,007 ====== ====== ====== ====== Year ended 31 May 2015 Year ended 1 June 2014 Basic earnings per ordinary share 6 38.3p 25.2p Diluted earnings per ordinary share 6 38.3p 25.1p Basic earnings per ordinary share – pre - exceptional items 6 38.2p 36.1p Diluted earnings per ordinary share – pre - exceptional items 6 38.1p 36.0p CONSOLIDATED STATEMENT OF COMPREHENSIVE INCOME Year ended Year ended 31 May 2015 1 June 2014 £000 £000 Profit attributable to owners of the parent 12,257 8,007 Other comprehensive expense Items that may be reclassified to profit or loss Exchange differences on translation of foreign operations (473) (1,233) ---------- ---------- Other comprehensive expense for the period (473) (1,233) ---------- ---------- Total comprehensive income attributable to owners of the parent 11,784 6,774 ====== ====== The following notes form an integral part of this condensed consolidated financial information. CONSOLIDATED BALANCE SHEET 31 May 2015 1 June 2014 Notes £000 £000 Non - current assets Goodwill 1,433 1,433 Other intangible assets 9 8,262 8,683 Property, plant and equipment 1 0 22,719 21,027 Trade and other receivables 1,195 1,408 Deferred tax assets 3,621 4,715 ---------- ---------- 37,230 37,266 ---------- ---------- Current assets Inventories 7, 625 8,035 Trade and other receivables 9,4 25 9,145 Current tax assets 600 636 Cash and cash equivalents 8 12,561 17,550 ---------- ---------- 30,211 35,366 ---------- ---------- Total assets 67,441 72,632 ---------- ---------- Current liabilities Trade and other payables (13,131) (12,765) Current tax liabilities (1,434) (587) Provisions 1 1 (529) (3,009) ---------- ---------- (15,094) (16,361) ---------- ---------- Net current assets 15,117 19,005 ---------- ---------- Non - current liabilities Other non - current liabilities (364) (360) Provisions 1 1 (458) (517) ---------- ---------- (822) (877) ---------- ---------- Net assets 51,525 55,394 ====== ====== Capital and reserves Called up share capital 1,603 1,593 Share premium account 10,218 9,490 Other reserves 1,182 1,655 Retained earnings 38,522 42,656 ---------- ---------- Total equity 51,525 55,394 ====== ====== The following notes form an integral part of this condensed consolidated financial information. CONSOLIDATED STATEMENT OF CHANGES IN TOTAL EQUITY Called up Share share premium Other Retained Total capital account R eserves earnings e quity £000 £000 £000 £000 £000 At 1 June 201 4 and 2 June 201 4 1,5 93 9, 490 1,655 42,656 55,394 Profit for the year to 31 May 2015 - - - 12,257 12,257 Exchange differences on translation of foreign operations - - (473) - (473) ---------- ---------- ---------- ---------- ---------- Total comprehensive (expense)/ income for the period - - ( 473 ) 12,257 11,784 Transactions with owners: Share - based payments - - - 232 232 Shares issued under employee sharesave scheme 10 728 - - 738 Deferred tax c harge relating to share options - - - (71) (71) C urrent tax credit relating to exercised share options - - - 49 49 Dividends paid to Company shareholders - - - (16,601) (16,601) ---------- ---------- ---------- ---------- ---------- Total transactions with owners 10 728 - (16,391) (15,653) --------- - ---------- ---------- ---------- ---------- At 31 May 2015 1,603 10,218 1,182 38,522 51,525 ====== ====== ====== ====== ====== Called up Share share premium Other Retained Total capital account R eserves earnings e quity £000 £000 £000 £000 £000 At 2 June 201 3 and 3 June 201 3 1, 586 9,059 2, 888 3 4,321 47,854 Profit for the year to 1 June 2014 - - - 8,007 8,007 Exchange differences on translation of foreign operations - - ( 1,233 ) - (1,233 ) ---------- ---------- ---------- ---------- ---------- Total comprehensive (expense)/ income for the period - - (1,233) 8,007 6,774 Transactions with owners: Share - based payments - - - 288 288 Shares issued under employee sharesave scheme 7 431 - - 438 Deferred tax c harge relating to share options - - - (34) (34) Current tax credit relating to exercised share options - - - 74 74 ---------- ---------- ---------- ---------- ---------- Total transactions with owners 7 431 - 328 766 ---------- ---------- ---------- ---------- ---------- At 1 June 2014 1,593 9,490 1,655 42,656 55,394 ====== ====== ====== ====== ====== The following notes form an integral part of this condensed consolidated financial information. CONSOLIDATED CASH FLOW STATEMENT Year ended Year ended 31 May 1 June 2015 2014 Notes £000 £000 Cash flows from operating activities Cash generated from operations 7 25,579 24,997 UK corporation tax paid (1,912) (4,492) Overseas tax paid (393) (229) ---------- ---------- Net cash from operating activities 23,274 20,276 ---------- ---------- Cash flows from investing activities Purchases of property, plant and equipment (6,783) (5,673) Proceeds on disposal of property, plant and equipment 26 54 Purchases of other intangible assets (1,012) (1,522) Expenditure on product development (4,579) (4,652) Interest received 115 104 ---------- ---------- Net cash from investing activities ( 12,233 ) (11,689) ---------- ---------- Cash flows from financing activities Proceeds from issue of ordinary share capital 738 438 Interest paid (1) - Dividends paid to Company shareholders (16,601) (5,077) ---------- ---------- Net cash from financing activities (15,864) (4,639) ---------- ---------- Net (decrease)/ increase in cash and cash equivalents (4,823) 3,948 Opening cash and cash equivalents 17,550 13,931 Effects of foreign exchange rates on cash and cash equivalents (166) (329) ---------- ---------- Closing cash and cash equivalents 8 12,561 17,550 ====== ====== The following notes form an integral part of this condensed consolidated financial information. NOTES TO THE FINANCIAL INFORMATION 1. General information The consolidated financial statements of Games Workshop Group PLC are prepared under the going concern ba sis and in accordance with International Financial Reporting Standards (IFRSs), International Financial Reporting Interpretations Committee (IFRIC) interpretations and Standing Interpretations Committee (SIC) interpretations as adopted by the European Union and w ith those parts of the Companies Act 2006 applicable to those companies reporting under IFRSs. These results for the year ended 31 May 201 5 together with the corresponding amounts for the year ended 1 June 201 4 are extracts from the 20 1 5 annual report a nd do not constitute statutory accounts within the meaning of section 434 of the Companies Act 2006. The annual report for the year ended 31 May 201 5 , on which the auditors have issued a report that does not contain a statement under either section 498(2) or 498(3) of the Companies Act 2006, will be posted to shareholders on 29 July 201 5 and will be delivered to the Registrar of Companies in due course. Copies will also be available from Rachel Tongue, Games Workshop Group PLC, Willow Road , Lenton, Notting ham, NG7 2WS. This information is also available on the Company’s website at http://investor.games - workshop.com . The annual general meeting will be held at Willow Road, Lenton, Nottingham, NG7 2WS at 10.00am on 1 6 September 201 5 . The annual financial rep ort is prepared in accordance with the Listing Rules and Disclosure and Transp arenc y Rules of the Financial Conduct Authority and accounting policies consistent with those used in the 201 4 annual report . The preparation of the consolidated financial statements requires management to make estimates and assumptions that affect the reported amounts of revenues, expenses, assets and liabilities, and disclosure of contingencies at the balance sheet date. If in future such estimates and assumptions, which a re based on management's best judgement at the date of the consolidated financial statements, deviate from actual circumstances, the original estimates and assumptions will be modified, as appropriate, in th e period in which the circumstances change. The f ollowing areas are considered of greater complexity and/or particularly subject to the exercise of judgement:  M anagement estimates and judgements are required in assessing the impairment of assets, including capitalised development costs and fixtures and fittings within loss making retail stores , particularly in relation to the forecasting of future cash flows and the discount rate applied to the cash flows.  J udgement is involved in assessing the exposures in the provisions (including inventory, loss making retail stores , other property, bad debt and returns) and hence in setting the level of the required provisions. 2. Segment information The chief operating decision - maker has been identified as the executive directors. They review the Group’s internal reporting in order to assess performance and allocate resources. Management has determined the segments based on these reports. As Games W orkshop is a vertically integrated business, management assess es the performance of sales channels and manufacturing and distribution channels separately. At 31 May 2015, the Group is organised as follows: - Sales channels. These channels sell product to ex ternal customers, through the Group’s network of r etail stores, independent retailers and directly via the global web store. The sales channels have been aggregated into segments where they sell products of a similar nature, have similar production process es, similar customers, similar distribution methods, and if they are affected by similar economic factors. The segments are as follows: - Trade. This sales channel sells globally to independent retailers and also includes the Group’s magazine newsstand busin ess and the distributor sales from the Group’s publishing business (Black Library). - Retail. T his includes sales through the Group’s r etail stores, the Group’s visitor centre in Nottingham, and global exhibitions. - Mail order. This includes sales through the Group’s global web store s and digital sales through external affiliates. - Product and supply. This includes the design and manufacture of the products and incorporates the production facility in the UK and the Group logistics and stock management costs. - Ce ntral costs. These include the Company overheads, head office site costs , and the costs of running the Games Workshop Academy. This also includes adjustments for the profit in stock arising from inter - segment sales. - Service centre costs. Provides support s ervices (IT, accounting, payroll, personnel, procurement, legal and customer services) to activities across the Group and undertakes strategic projects . - Royalties. This is royalty income earned from third party licensees after deducting associated licensin g costs. The chief operating decision - maker assesses the performance of each segment based on operating profit, excluding share option charges recognised under IFRS 2, ‘Share - based payments’. This has been reconciled to the Group’s total profit before taxation below. The segment information reported to the executive directors for the year ended 31 May 2015 is as follows: External revenue Restated Year ended 31 May 2015 £000 Year ended 1 June 2014 £000 Trade 43,940 46,903 Retail 49,597 51,974 Mail order 25,595 24,624 ------------ ------------ Total revenue 119,132 123,501 ====== ====== Segment revenue and segment profit include transactions between business segments; these transactions are eliminated on consolidation. Sales between segments are carried out at arm’s length. The revenue from external parties reported to the exec utive directors is measured in a manner consistent with that in the income statement. For information , we analyse external revenue further below: Year ended 31 May 2015 £000 Year ended 1 June 2014 £000 Trade UK and Continental Europe 15,420 17,475 North America 17,740 16,498 A ustralia and New Zealand 2,000 1,971 Non - core trade 8 ,780 1 0,959 ---------- ----------- Total Trade 43,940 46,903 Retail UK 17,496 16,631 Continental Europe 13,879 16,349 North America 9,806 9,981 Australia and New Zealand 5,619 5,555 Non - core retail 2,797 3,458 ---------- ---------- Total Retail 49,597 51,974 Total Mail o rder 25,595 24,624 ----------- ------------ Total external revenue 119,132 123,501 ====== ===== Operating expenses by segment are regularly reviewed by the executive directors and are provided below: Year ended 31 May 2015 £000 Restated Year ended 1 June 2014 £000 Trade (7,946) (9, 627 ) Retail (33,974) (37,288) Mail o rder (4,326) (4,125) Product and supply (3,111) ( 3 ,841) Central costs (6,206) ( 4,968 ) Service centre costs (11,215) (11,157) Royalties (429) (374) ------------ ----------- Total group operating expenses (67,207) (7 1 , 3 80) ======= ====== Total segment operating profit is as follows and is reconciled to profit before taxation below: Restated Year ended 31 May 2015 £000 Year ended 1 June 2014 £000 Operating profit Trade 10,970 14,838 Retail (1,050) (1,636) Mail o rder 14,241 14,14 2 Product and supply 8,643 206 Central costs (6,179) ( 5,240 ) Service centre costs (11,217) (11,081) Royalties 1,069 1,068 ---------- --------- Total group operating profit 16,477 12,297 Finance income 109 106 Finance costs (1) (7) ---------- ---------- Profit before taxation 16,585 12,396 ====== ===== 3. Exceptional items The exceptional credit of £42,000 reported in the current year relates to the release of amounts previously provided for the continental european restructure. The exceptional items reported in the prior period relate to the continental european reorganisat ion announced in January 2014. As part of this reorganisation £2,987,000 was incurred in redundancy and severance costs, £608,000 in closing l ocal country head offices and £905,000 in professional fees and other costs. 4. Dividends per share A dividend of 1 6 pence per share, amounting to a total dividend of £5,077,000, was paid during the year ended 1 June 2014 and was declared in the prior period . A dividend of 20 pence per share, amounting to a total dividend of £6,373,000, a dividend of 16 pence per share , amounting to a total dividend of £5,099,000, and a further dividend of 16 pence per share, amounting to a total dividend of £5,129,000, were declared and paid during the current period. 5. Tax Pre - exceptional Exceptional Year ended items Year ended items Year ended Total Year ended 31 May 2015 £000 1 June 2014 £000 1 June 2014 £000 1 June 2014 £000 Current UK taxation: - UK corporation tax on profits for the period - Under/(o ver ) provision in respect of prior periods 3,165 253 2,956 (54) - - 2,956 (54) UK corporation tax on exceptional items for the period 9 - (1,051) (1,051 ) -------- -------- ---------- -------- Current overseas taxation: - Overseas corporation tax on profits for the period - Over provision in respect of prior periods 3,427 347 ( 539 ) 2,902 908 (360) (1,051) - - 1,851 908 (360) --------- --------- ---------- ----------- Total current taxation 3, 235 3,450 (1,051) 2,399 -------- -------- --------- ----------- Deferred taxation: - Origination and reversal of timing differences - Under provision in respect of prior periods 893 200 1,645 314 31 - 1,676 314 -------- -------- -------- ----------- Tax expense /( income ) recognised in the income statement 4,328 5,409 (1,020) 4,389 ===== ====== ===== ===== Current tax credit relating to sharesave scheme ( 49 ) (74) - (74) Deferred tax charge relating to sharesave scheme 71 34 - 34 ------- ------ ------- ------- Charge/(c redit ) taken directly to equity 22 (40) - (40) ==== === ==== ===== The tax on the Group’s profit before taxation differs from the standard rate of corporation tax in the UK as follows: Year ended Year ended 3 1 May 2015 £000 1 June 2014 £000 Profit before taxation 16,585 12,396 Profit before taxation multiplied by the standard rate of corporation tax in the UK of 20.83 % (201 4 : 2 2.67 %) Effects of: Items not deductible for tax purposes Movement in deferred tax not recognised Higher tax rates on overseas earnings Adjustments to tax charge in respect of prior periods 3,455 481 (4) 482 (86) 2,810 662 (10) 1,027 (100) -------- -------- Total tax charge for the period 4,328 4,389 ===== ===== Included within the £4,328,000 disclosed above, £11,000 relates to changes in rates of UK corporation tax in the year from 21% to 20% from 1 April 2015. Further reductions were included in the Summer Budget 2015 announced on 8 July 2015, which has not been substantively enacted, to reduce the rate to 19% from 1 April 2017 and 18% from 1 A pril 2020. The overall effect of these further changes, if applied to the deferred tax balance at the balance sheet date, would be to reduce the deferred tax asset by an ad ditional £9,000. 6. Earnings per share Basic earnings per share Basic earnings per share is calculated by dividing the profit attributable to owners of the parent by the weighted average number of ordinary shares in issue during the period. Year ended 3 1 May 201 5 Year ended 1 June 201 4 Profit attributable to owners of the parent (£000) 12,257 8 ,007 Weighted average number of ordinary shares in issue (thousands) 31,975 31, 805 Basic earnings per share (pence per share) 38.3 25.2 ===== ==== Basic earnings per share - pre - exceptional items Basic earnings per share - pre - exceptional items is calculated by dividing the profit attributable to owners of the parent, before exceptional items, by the weighted average number of ordinary shares in issue during the period. Year ended 31 May 2015 Year ended 1 June 201 4 Pre - exceptional profit attributable to owners of the parent (£000) 12,215 1 1,487 Weighted average number of ordinary shares in issue (thousands) 31,975 31, 805 Basic earnings per share – pre - exceptional items (pence per share) 38. 2 36.1 ==== ==== Diluted earnings per share The calculation of diluted earnings per share has been based on the profit attributable to owners of the parent and the weigh ted average number of shares in issue throughout the period, adjusted for the dilutive effect of share options outstanding at the period end. Year ended 31 May 2015 Year ended 1 June 201 4 Profit attributable to owners of the parent (£000) 12,257 8,007 Weighted average number of ordinary shares in issue (thousands) 31,975 31,805 Adjustment for share options (thousands) 50 129 ---------- ---------- Weighted average number of ordinary shares for diluted earnings per share (thousands) 32,025 31, 934 Diluted earnings per share (pence per share) 38.3 25.1 ==== ==== Diluted earnings per share - pre - exceptional items The calculation of diluted earnings per share - pre - exceptional items has been based on the profit attributable to owners of the parent, before exceptional items, and the weighted average number of shares in issue throughout the period, adjusted for the dilutive effect of share options outstanding at the period end. Year ended 3 1 May 2015 Year ended 1 June 201 4 Pre - exceptional profit attributable to owners of the parent (£000) 12,215 1 1,487 Weighted average number of ordinary shares in issue (thousands) 31,975 31,805 Adjustment for share options (thousands) 50 129 --------- --------- Weighted average number of ordinary shares for diluted earnings per share (thousands) 32,025 31, 934 Diluted earnings per share – pre - exceptional items (pence per share) 38.1 36.0 ==== ==== 7. Reconciliation of profit to net cash from operating activities 201 5 £000 201 4 £000 Operating profi t 16,477 12,297 Depreciation of property, plant and equipment 4,991 4,907 Net impairment /( reversal ) on property, plant and equipment 9 (204) Loss on disposal of property, plant and equipment 33 370 Loss on disposal of intangible asse ts 24 333 Amortisation of capitalised development costs 4,728 4,121 Amortisation of other intangibles 1,362 849 Share - based payments 232 288 Changes in working capital: - Dec rease /(increase) in inventories 882 (468) - (Increase)/d ecrease in trade and other receivables (242) 1,545 - Decrease in trade and other payables (395) (952) - - (D ecrease) /increase in provisions (2,522) 1,911 --------- --------- Net cash from operating activities 25,579 24,997 ===== ===== 8. Cash and cash equivalents Cash and cash equivalent s include the following for the purposes of the cash flow statement: 201 5 £000 201 4 £000 Cash at bank and in hand 1 1,942 1 6,432 Short - term bank deposits 619 1,118 ---------- ---------- Cash and cash equivalents 12,561 1 7,550 ===== ===== 9. Other intangible assets 201 5 201 4 £000 £000 Net book value at beginning of the year 8,683 8,033 Additions 5,695 5,968 Exchange differences (2) (15) Disposals (24) ( 333 ) Amortisation charge (6,090) ( 4,970 ) ---------- ---------- Net book value at end of the year 8,262 8, 68 3 ====== ====== 10. Property, plant and equipment 201 5 201 4 £000 £000 Net book value at beginning of the year 21,027 20,604 Additions 6,753 5,739 Exchange differences (2) (189) Disposals (59) (424) Charge for the period (4,991) (4,907) Impairment (9) 204 ---------- ---------- Net book value at end of the year 22,719 21,027 ====== ====== 11. Provisions Analysis of total provisions: 201 5 201 4 £000 £000 Current 529 3,009 Non - current 458 517 ---------- ---------- Total provisions 987 3,526 ====== ====== Exceptional Employee items benefits Property Total £000 £000 £000 £000 A t 1 June 201 4 2,470 568 488 3,526 Charged/(credited) to the income statement (42) (3) 236 191 Exchange differences 44 (26) 8 26 Utilised (2,446) (47) (263) (2,756) --------- -------- -------- ---------- At 3 1 May 2015 26 492 469 987 ===== ==== ==== ====== 12. Commitments Capital expenditure contracted for at the balance sheet dat e but no t yet incurred is £ 447 ,000 (201 4 : £ 4 78 ,000 ) . Inventory purchase commitments contracted for at the balance sheet date are £1,898 ,000 (2014: £365,000). 13. Related - party transactions There were no material related - party transactions during the current or prior period.