/
Topic B.1 Understand the planning tools businesses use to p Topic B.1 Understand the planning tools businesses use to p

Topic B.1 Understand the planning tools businesses use to p - PowerPoint Presentation

alida-meadow
alida-meadow . @alida-meadow
Follow
386 views
Uploaded On 2015-10-06

Topic B.1 Understand the planning tools businesses use to p - PPT Presentation

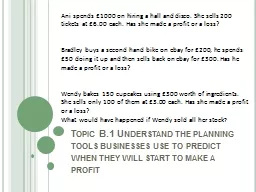
Ani spends 1000 on hiring a hall and disco She sells 200 tickets at 600 each Has she made a profit or a loss Bradley buys a second hand bike on ebay for 200 he spends 50 doing it up and then sells back on ID: 151217

costs breakeven profit units breakeven costs units profit fixed point business charts total price chart revenues loss output cost

Share:

Link:

Embed:

Download Presentation from below link

Download Presentation The PPT/PDF document "Topic B.1 Understand the planning tools ..." is the property of its rightful owner. Permission is granted to download and print the materials on this web site for personal, non-commercial use only, and to display it on your personal computer provided you do not modify the materials and that you retain all copyright notices contained in the materials. By downloading content from our website, you accept the terms of this agreement.


Presentation Transcript

Slide1

Topic B.1 Understand the planning tools businesses use to predict when they will start to make a profit

Ani

spends £1000 on hiring a hall and disco. She sells 200 tickets at £6.00 each. Has she made a profit or a loss?

Bradley buys a second hand bike on

ebay

for £200, he spends £50 doing it up and then sells back on

ebay

for £300. Has he made a profit or a loss?

Wendy bakes 150 cupcakes using £300 worth of ingredients. She sells only 100 of them at £3.00 each. Has she made a profit or a loss?

What would have happened if Wendy sold all her stock

?Slide2

Topic B.1 Understand the planning tools businesses use to predict when they will start to make a profit

By the end of this topic you will be able to:

Define breakeven

Interpret a breakeven chart

Calculate breakeven

Analyse and explain the importance of breakeven analysis

Analyse and explain the risk of not completing a breakeven analysis

Present information on a breakeven chart

Analyse the effect of changes to breakevenSlide3

Breakeven

Breakeven is

when a business has enough revenue from sales to cover the costs of making the products

T

he point at which a business is not making a profit or a loss i.e. it is just breaking even

Therefore at this point total costs must be the same as total revenueTR > TCTR = TCTR < TC

Can you explain these emotions

?Slide4

Breakeven charts

Breakeven can be calculated by plotting the lines on a breakeven chart

This makes it easy to see where the breakeven point is i.e. where Total Costs = Total Revenue

Breakeven point is expressed as a number of units e.g. 2000 T-shirtsSlide5

Breakeven Charts – the build up

Fixed costs

stay the same and are therefore a ___________ ___________ line.

Variable costs change in relation to the number of items produced and therefore start at ____ and slope __________. Total Costs are fixed costs plus variable costs and therefore start at the point of ______ ____and then slope upwards at the same gradient as __________ _____.

£

No of items

£

No of items

£

No of itemsSlide6

Breakeven Charts – the build up

Total Revenue

increases with the amount of units sold and therefore starts at ______ and slopes ________ .

We now have to put our cost and revenue lines together to find the breakeven point. The important 2 lines being total costs (TC) and total revenue (TR).

No of items

£Slide7

Breakeven Charts – the build up

Costs and revenues

£

Units

0

FC

VC

TC

TRSlide8

Breakeven Charts

Costs and revenues

£

Units

0

FC

TC

TR

Breakeven point

Breakeven outputSlide9

Breakeven Chart

What are the fixed costs at 2000 units?

What are the variable costs at 2000 units?

What are the total costs at 1000 units?

What is the total revenue at 3000 units?

What is the breakeven level of output?Slide10

Using a breakeven chartAs well as identifying costs, revenues and break even a breakeven chart can also be used to:

Identify the margin of safety

the difference between actual output and breakeven output

Actual output – breakeven output = margin of safetySlide11

Breakeven Charts

Costs and revenues

£

Units

0

FC

TC

TR

Breakeven output

Actual output

Margin of safetySlide12

Breakeven Chart

What is the breakeven level of output?

Actual output is 3000 units. What is the margin of safety?Slide13

Using a breakeven chartAs well as identifying costs, revenues, breakeven and margin of safety a breakeven chart can also be used to:

Calculate profit at different levels of output

Calculate loss at different levels of outputSlide14

Breakeven Charts

Costs and revenues

£

Units

0

FC

TC

TR

Loss

ProfitSlide15

Breakeven Charts

£

No of items

TR

TC

Q1

TC1

TR1

TC1>TR1 = Loss

Q2

Q3

TR3

TC3

TR3 >TC3 = Profit

TC2 = TR2 = BEPSlide16

Breakeven Chart

At 1500 units will the business make a profit or a loss?

At 2500 units will the business make a profit or a loss?

If they sell 1000 units how much profit or loss is made?

If they sell 3000 units how much profit or loss is made?Slide17

Breakeven

Why might a start-up business be satisfied if it breaks even in its first year?

Statement

True or false

Explain your answer

Fixed cost is a horizontal straight lineTotal cost line starts at zero

Breakeven point is where total revenue is equal to variable costs

If TC is less than TR a business has passed breakeven point

Margin of safety is to the right of breakeven

If fixed costs go up and everything else stays the same breakeven point will riseSlide18

Calculating breakevenBreakeven can be calculated using the following formula:

In the examination the formula will be given to you.

fixed costs

selling price per unit – variable cost per unitSlide19

Calculating breakeven

A business manufactures computer desks.

Fixed costs = £10 000

Variable cost per desk = £22

Selling price = £47

How many desks do they need to sell to breakeven? fixed costs selling price per unit – variable cost per unitSlide20

Calculating breakeven

A business manufactures computer desks.

Fixed costs = £10 000

Variable cost per desk = £22

Selling price = £47

How many desks do they need to sell to breakeven?Step 1: £10 000 Step 2: £10 000 Step 3: 400 desks £47 - £22 £25 fixed costs

selling price per unit – variable cost per unitSlide21

Drawing a breakeven Chart

A business manufactures computer desks.

Fixed costs = £10 000

Variable cost per desk = £22

Selling price = £47

Draw a break even chartStep 1: Complete the table belowStep 2: plot the total cost and total revenue line on graph paperStep 3: label the breakeven point

Desks0

200400600

FC

VC

TC

TRSlide22

Question time 1 mark

A business manufactures rocking horses.

The table shows their predicted figures for the next year.

How many rocking horses do they need to sell to breakeven?

rocking horses

fixed costs selling price per unit – variable cost per unit

£

Selling price per rocking horse

100

Variable cost per rocking horse40Fixed costs

12 000Slide23

Break even

Kristen runs a small business making balloon decorations for weddings, birthday and corporate events. She sells an average of 100 displays per month at a price of £90. Each balloon display costs £20 to make. She delivers them to venues costing her £1000 per month, pays an assistant a wage of £900 per month and advertises in a local paper for £150 per month. As a sole trader Kristen does not pay herself any money but is hoping to be able to take money out of the business if it makes a profit.

Question time

What is meant by the term

‘breakeven’?

(

2 marks)

Calculate Kristen’s breakeven point.

(4 marks)Will Kristen be able to take some money out of the business? Justify your answer. (3marks)Slide24

Importance of BreakEven analysis to businesses when planning for success

Prior to trading an entrepreneur may draw a break even chart or calculate breakeven to help see if their proposal is feasible i.e. how many units will they need to sell to breakeven

This can then be compared to predicted sales estimated from market research

If predicted sales is greater than breakeven point they may then consider by how much

Help identify and track costs

Identify where costs can be reduced e.g. change suppliersCan calculate predicted profit or lossCan help make decisions about what price to charge Slide25

Risk of not completing Breakeven analysis

Will not know how many items need to be sold to breakeven

Difficult to set targets

Will not know margin of safety

Costs may be higher than revenue

May be hard to raise finance, a bank manager may want a business to prove it can reach break even pointDecisions re price may be wrong as ill informedSlide26

Variables change!

A breakeven chart shows costs and revenues but what happens if theses change?

What variables might change?

Fixed Costs

Landlord puts rent up

Bank changes interest ratesManagement want pay increaseVariable CostsRaw materials change in priceMinimum wage is increasedUtility companies change priceSelling PriceNew competition therefore forced to lower pricePositive word of mouth puts demand up

Work in pairs to explain what would happen to breakeven in each instance.Slide27

Breakeven Charts – changing variables – what would happen if fixed costs rose?

Costs and revenues

£

Units

0

FC

TC

TRSlide28

Breakeven Charts – changing variables – Rise in fixed costs

Costs and revenues

£

Units

0

FC

TC

TRSlide29

Breakeven Charts – changing variables – What would happen if variable costs fell?

Costs and revenues

£

Units

0

FC

TC

TRSlide30

Breakeven Charts – changing variables – variable costs fall

Costs and revenues

£

Units

0

FC

TC

TRSlide31

Breakeven Charts – changing variables – what would happen if there was a new competitor and price was lowered?

Costs and revenues

£

Units

0

FC

TC

TRSlide32

Breakeven Charts – changing variables – lower price

Costs and revenues

£

Units

0

FC

TC

TRSlide33

Topic B.1 Understand the planning tools businesses use to predict when they will start to make a profit

You have now completed this topic, are you able to?

Be able to define breakeven

Interpret a breakeven chart

Calculate breakeven

Analyse and explain the importance of breakeven analysisAnalyse and explain the risk of not completing a breakeven analysisPresent information on a breakeven chartAnalyse the effect of changes to breakevenTry the test yourself quiz number 3