/
Funding Sources 	 	 	Operating Fund Funding Sources 	 	 	Operating Fund

Funding Sources Operating Fund - PowerPoint Presentation

altigan
altigan . @altigan
Follow
343 views
Uploaded On 2020-08-05

Funding Sources Operating Fund - PPT Presentation

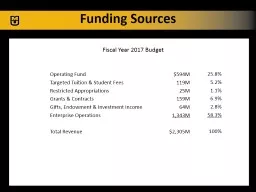
Targeted Tuition amp Student Fees Restricted Appropriations Grants amp Contracts Gifts Endowment amp Investment Income Enterprise Operations Total Revenue 594M ID: 798573

operating amp appropriations 2017 amp operating 2017 appropriations funding operations state 100 343m includes 594m revenue total general support

Share:

Link:

Embed:

Download Presentation from below link

Download The PPT/PDF document "Funding Sources Operating Fund" is the property of its rightful owner. Permission is granted to download and print the materials on this web site for personal, non-commercial use only, and to display it on your personal computer provided you do not modify the materials and that you retain all copyright notices contained in the materials. By downloading content from our website, you accept the terms of this agreement.


Presentation Transcript

Slide1

Funding Sources

Operating Fund Targeted Tuition & Student Fees Restricted Appropriations Grants & Contracts Gifts, Endowment & Investment Income Enterprise Operations Total Revenue

$594M 119M 25M 159M 64M 1,343M $2,305M

25.8%5.2%1.1%6.9%2.8%58.3%100%

Fiscal Year

2017

Budget

Slide2

“Enterprise” Operations

Hospitals & ClinicsUniversity PhysiciansAthleticsUniversity StoresResidential LifeCampus Dining

Veterinary MedicineResearch ReactorAgricultureParkingKOMUOffice of Research/Patent & RoyaltyOther

$841M191M66M52M43M

29M

20M

18M

9M8M10M2M 54M$1,343M

62.6%

14.2%

4.9%

3.9%

3.2%

2.2%

1.5%

1.3%

0.7%

0.6%

0.7%

0.1%

4.1%

100%

Slide3

General Operating

SourcesFY 17 Total: $594M Operating FundState Appropriations $229M Tuition $331M Indirect Cost $34M

Slide4

27%

70%3 %

Change in General Operating Funding SourcesTUITIONSTATE SUPPORT

Slide5

Revenue Drivers

FY 2001 – FY 2017** FY 2017 Projected # Includes FY17 Withholdings

Slide6

State Support to Higher Education

FY 2015 National Comparison*Appropriation per Capita Ranking*Information obtained from the Grapevine Report published by Illinois State University437

19221030236

21

Slide7

Funding per Student FTE

$120,623,736$23,206

* Includes Appropriations for Extension