PPT-Averages or measures of central tendency
Author : alyssa | Published Date : 2023-09-21
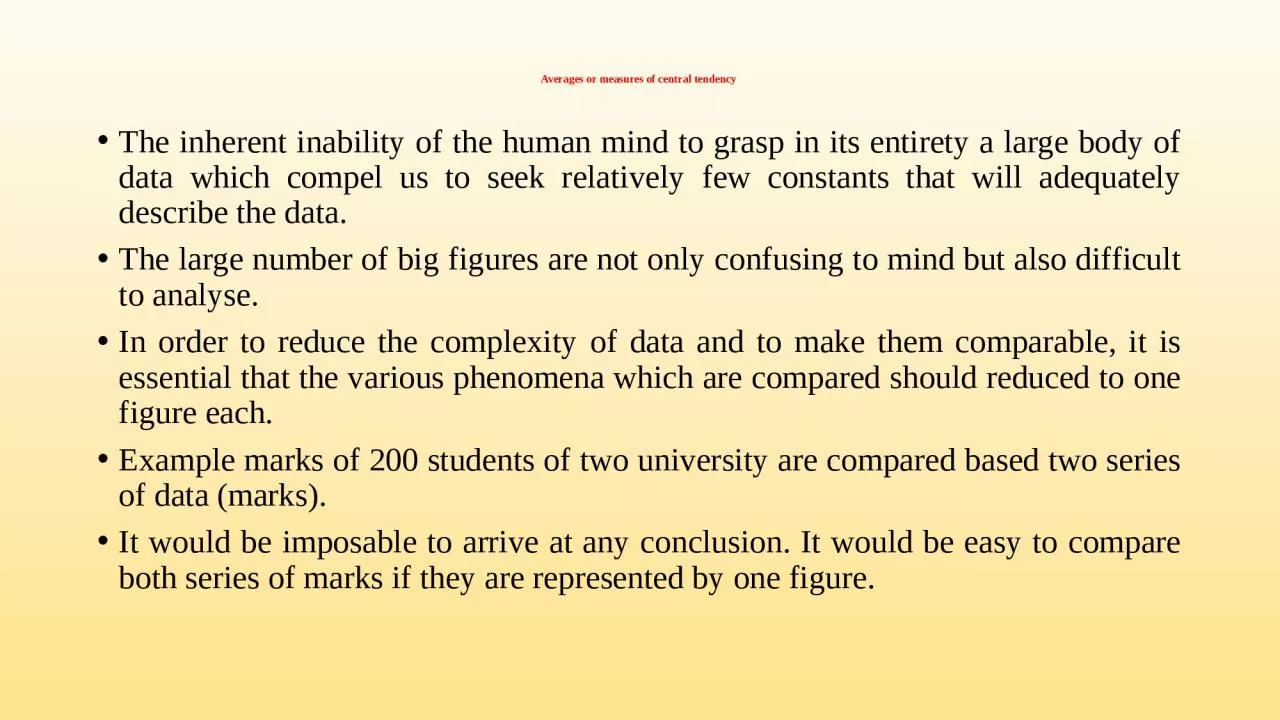
The inherent inability of the human mind to grasp in its entirety a large body of data which compel us to seek relatively few constants that will adequately describe
Presentation Embed Code
Download Presentation
Download Presentation The PPT/PDF document "Averages or measures of central tendenc..." is the property of its rightful owner. Permission is granted to download and print the materials on this website for personal, non-commercial use only, and to display it on your personal computer provided you do not modify the materials and that you retain all copyright notices contained in the materials. By downloading content from our website, you accept the terms of this agreement.
Averages or measures of central tendency: Transcript
Download Rules Of Document
"Averages or measures of central tendency"The content belongs to its owner. You may download and print it for personal use, without modification, and keep all copyright notices. By downloading, you agree to these terms.
Related Documents