PPT-Leaf4.PC1 Leaf4.PC2 Leaf7.PC3
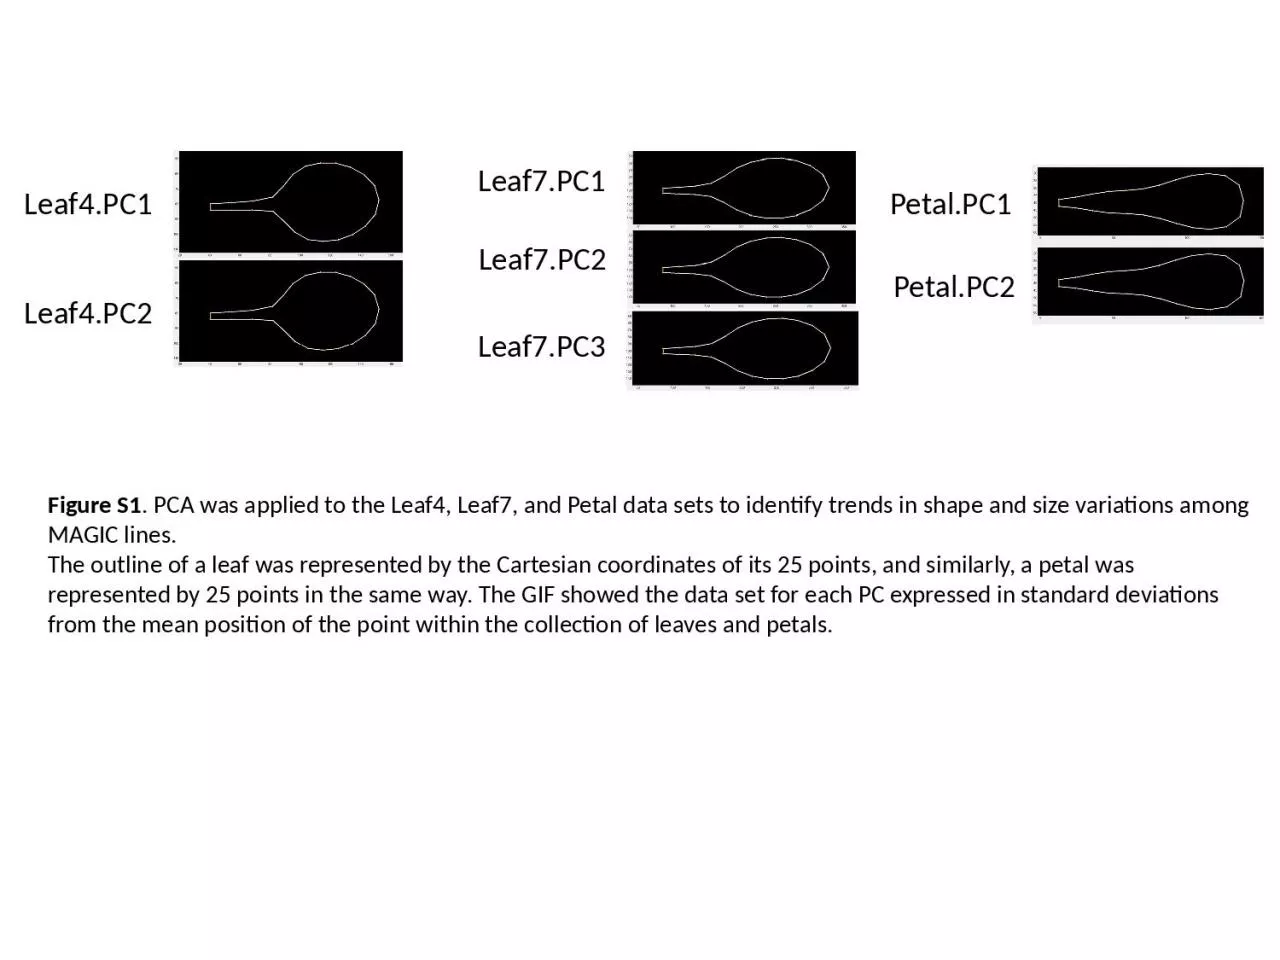
Leaf7PC2 Leaf7PC1 PetalPC1 PetalPC2 Figure S1 PCA was applied to the Leaf4 Leaf7 and Petal data sets to identify trends in shape and size variations among MAGIC
Download Presentation
"Leaf4.PC1 Leaf4.PC2 Leaf7.PC3" is the property of its rightful owner. Permission is granted to download and print materials on this website for personal, non-commercial use only, provided you retain all copyright notices. By downloading content from our website, you accept the terms of this agreement.
Presentation Transcript
Transcript not available.