/
Year Economic and Fiscal Outlook Year Economic and Fiscal Outlook

Year Economic and Fiscal Outlook - PDF document

anya
anya . @anya
Follow
349 views
Uploaded On 2021-09-14

Year Economic and Fiscal Outlook - PPT Presentation

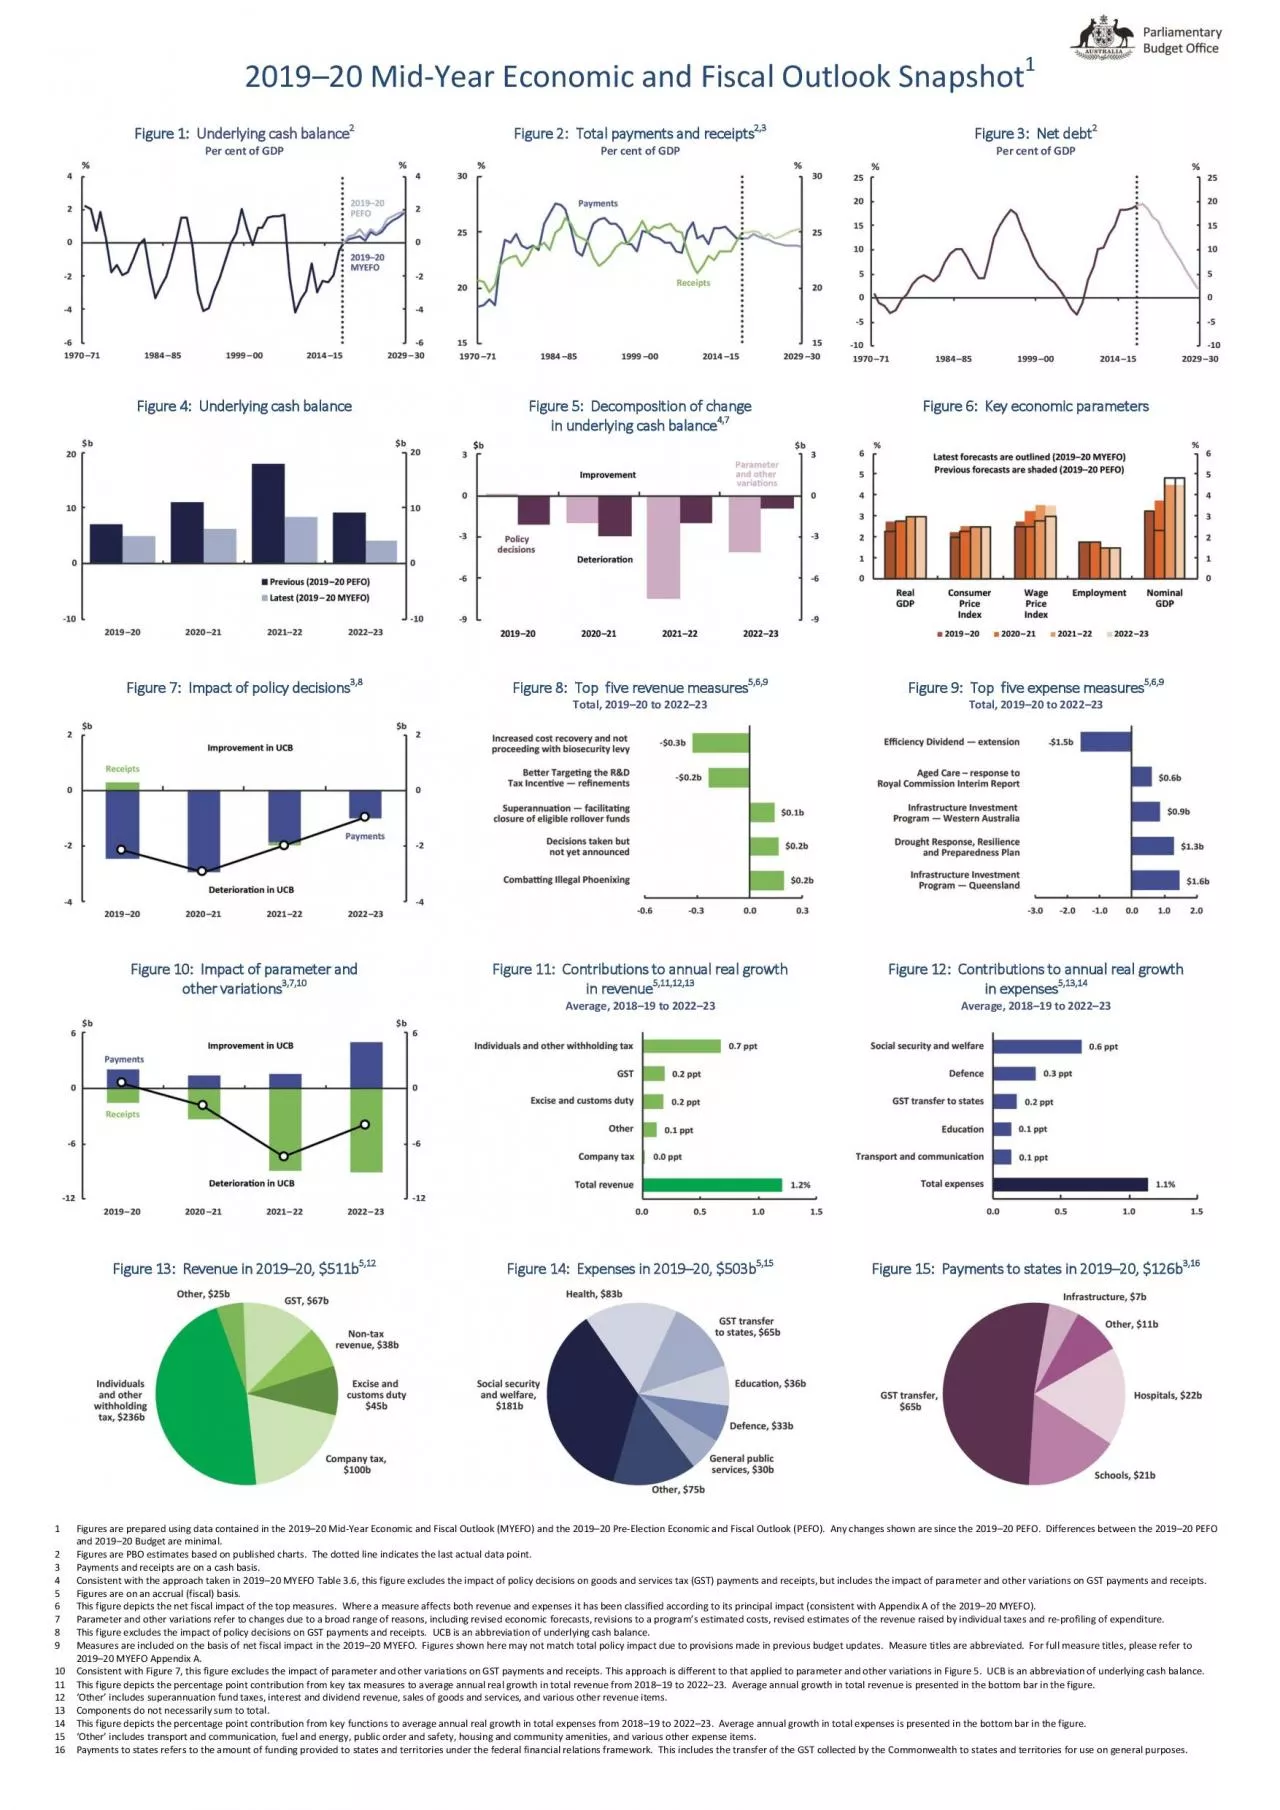
201920 MidSnapshot1Figure 1Underlyingcash balance2Per cent of GDPFigure 2 Total payments and receipts23Per cent of GDPFigure 3 Net debt2Per cent of GDPFigure 4Underlying cash balanceFigure 5Decompo ID: 880820

impact figure revenue 201 figure impact 201 revenue total payments annual receipts average cash 2022 fiscal growth myefo expenses

Share:

Link:

Embed:

Download Presentation from below link

Download Pdf The PPT/PDF document "Year Economic and Fiscal Outlook" is the property of its rightful owner. Permission is granted to download and print the materials on this web site for personal, non-commercial use only, and to display it on your personal computer provided you do not modify the materials and that you retain all copyright notices contained in the materials. By downloading content from our website, you accept the terms of this agreement.


Presentation Transcript

1 2019 – 20 M id - Year Economic and Fi
2019 – 20 M id - Year Economic and Fiscal Outlook Snapshot 1 Figure 1 : Underlying cash balance 2 Per cent of GDP Figure 2 : Total payments and receipts 2 ,3 Per cent of GDP Figure 3 : Net debt 2 Per cent of GDP Figure 4 : U nderlying cash balance Figure 5 : Decomposition of change in underlying cash balance 4 ,7 Figure 6 : Key economic parameters Figure 7 : Impact of p olicy decisions 3 ,8 Figure 8 : Top five revenue measures 5 , 6 , 9 Total, 201 9 – 20 to 2022 – 23 Figure 9 : Top five expense measures 5,6 , 9 Total, 201 9 – 20 to 2022 – 23 Figure 10 : Impact of p arameter and other variations 3 , 7 , 10 Figure 11 : C ontributions to annual real growth in revenue 5 , 11 ,1 2 ,13 Average, 2018 – 19 to 2022 – 23 Figure 12 : Contributions to annual real growth in expenses 5 , 1 3 ,14 Average, 2018 – 19 to 2022 – 23 Figure 13 : Revenue in 201 9 – 20 , $ 511 b 5 ,12 Figure 14 : Expenses in 201 9 – 20 , $ 503 b 5 ,1 5 Figure 15 : Payments to states in 201 9 – 20 , $ 126 b 3, 1 6 1 Figures are prepared using data contained in the 201 9 – 20 Mid - Y ear Economic and Fiscal Outlook (MYEFO) and the 2019 – 20 Pre - Election Economic and Fiscal Outlook (PEFO) . Any changes shown are since the 201 9 – 20 PEFO . Differences between the 201 9 – 20 PEFO and 201 9 – 20 Budget are minimal . 2 Figures are PBO estimates based on published charts . The dotted line indicates the last actual data point . 3 Payments and receipts are on a cash basis. 4 Consistent with the approach taken in 2019 – 20 MYEFO Table 3. 6 , th is figure exclude s the impact of policy decisions on g oods and s ervices t ax (GST) payments and receipts, but include s the impact of parameter and other variations on GST payments and receipts. 5 Figures are on an accrual (fiscal) basis. 6 This figure depicts the net fiscal impact of the top measures. Where a measure affects both revenue and expenses it has been classified a ccording to its principal impact (consistent with Appendix A of the 2019 – 20 MYEFO ). 7 Parameter and other variations refer to changes due to a broad range of reasons, including revised economic forecasts , revisions to a program’s estimated cost s, revised es timates of the revenue raised by individual taxes and re - profiling of expenditure. 8 T his figure excludes the impact of policy decisions on GST payments and receipts. UCB is an abbreviation of underlying cash balance. 9 Measures are included on the basis of net fiscal impact in the 2019 – 20 MYEFO . Figures shown here may not match total policy impact due to provisions made in previous budget updates. Measure titles are abbreviated. For full measure titles , please refer to 201 9 – 20 MYEFO Appendix A . 10 Consist ent with Figure 7, this figure excludes the impact of parameter and other variations on GST payments and receipts. T his approach is different to that applied to parameter and other variations in Figure 5. UCB is an abbreviation of underlying cash balance. 11 This figure depicts the percentage point contribution from key tax measures to average annual real growth in total revenue from 2018 – 19 to 2022 – 23. Average annual growth in total revenue is presented in the bottom bar in the figure. 12 ‘Other’ includes superannuation fund taxes, interest and dividend revenue, sales of goods and services, and various other revenue items. 13 Components do not necessarily sum to total. 14 This figure depicts the percentage point contribution from key functions to average annual r eal growth in total expenses from 2018 – 19 to 2022 – 23. Average annual growth in total expenses is presented in the bottom bar in the figure. 15 ‘ O ther’ includes transport and communication, fuel and energy, p ublic order and safety , h ousing and community amenities , and various other expense items. 16 Payments to states refer s to the amount of funding provided to s tates and t erritories under the f ederal f inancial r elations framework. This includes the transfer of the GST collected by the Commonwealth to s tate s and t erritories for use on general purposes.