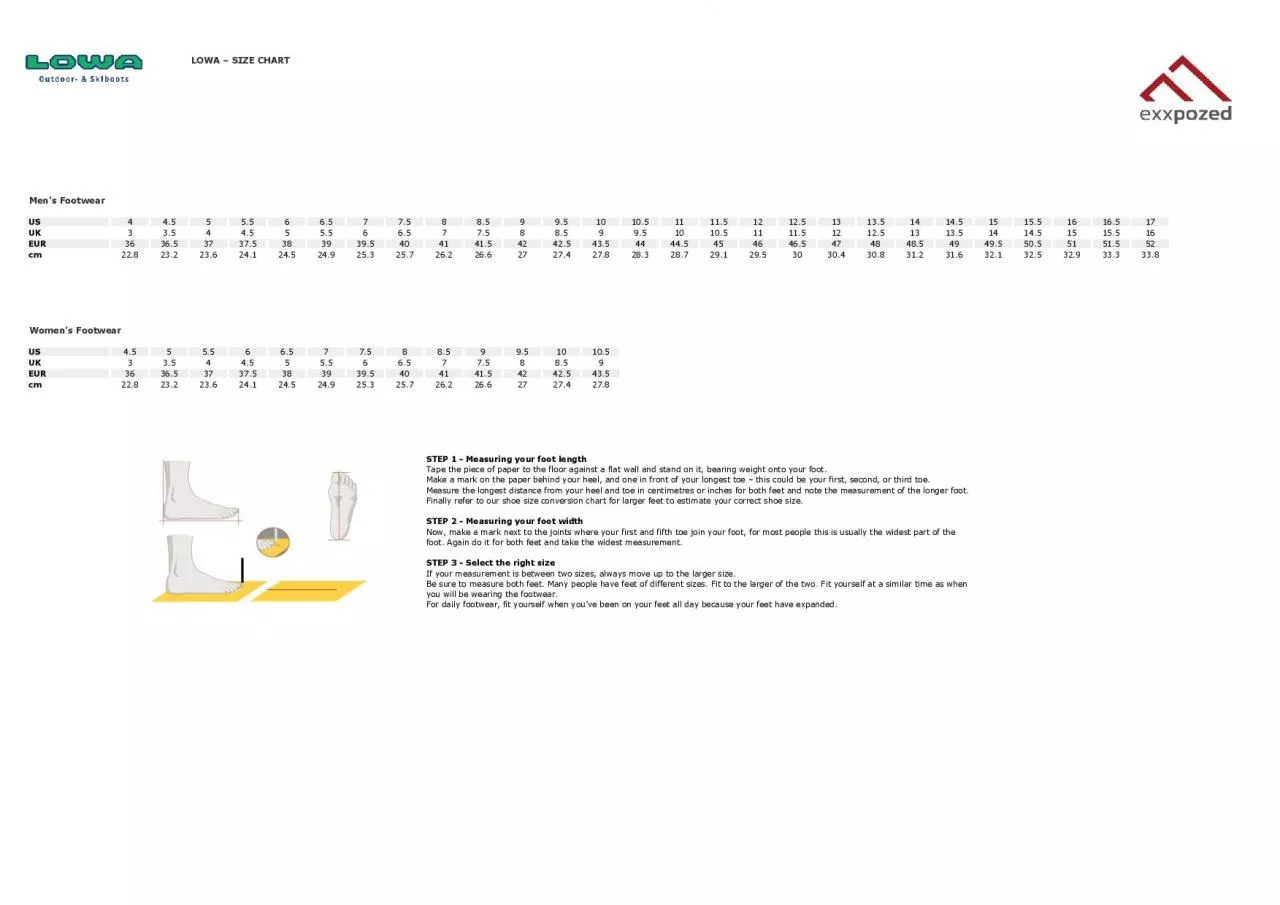
PDF-LOWA SIZE CHART
Author : ariel | Published Date : 2021-06-17
Mens Footwear US 4 45 5 55 6 65 7 75 8 85 9 95 10 105 11 115 12 125 13 135 14 145 15 155 16 165 17 UK 3 35 4 45 5 55 6 65 7 75 8 85 9 95 10 105 11 115 12 125 13 135 14 145 15
Presentation Embed Code
Download Presentation
Download Presentation The PPT/PDF document "LOWA SIZE CHART" is the property of its rightful owner. Permission is granted to download and print the materials on this website for personal, non-commercial use only, and to display it on your personal computer provided you do not modify the materials and that you retain all copyright notices contained in the materials. By downloading content from our website, you accept the terms of this agreement.
LOWA SIZE CHART: Transcript
Mens Footwear US 4 45 5 55 6 65 7 75 8 85 9 95 10 105 11 115 12 125 13 135 14 145 15 155 16 165 17 UK 3 35 4 45 5 55 6 65 7 75 8 85 9 95 10 105 11 115 12 125 13 135 14 145 15. WOMENS SIZE CHART 57426574455744757461574525744157458 574495745457443574485744557459 PLEASE NOTE 5742857448574455737657429573905742757390 com Education Slide Presentation. A presentation prepared by the . Pain Interest Group Nursing Issues . in association with the Agency of Clinical Innovation . Pain Management Network. Please direct comments to:. Ms. . …………………………………... based on . W D Gann . Astrononamy. . 1. www.stocktradingfundamentals.com. Birth Chart Showing Planetary Position At Time Of Birth. What Each Planet Stands For. Roch Valley Cardigan Size Chart. Childs Adults Age 3 / 4 5 / 6 7 / 8 9 / 10 11 / 13 - 10 12 14 16 18 Cm 96/104 110/116 122/128 134/14 (. A . 20 minute rant . on THE most useless . way of accessing . radar . data). by. Dr. Bradley Muller. The . Radar Summary chart. —an outmoded way of looking at radar data.. It is a computer-generated mosaic of radar echo intensity contours based on the Radar Weather Reports (SD/ROB) text product. . for . Dispersed Count . Data. Kimberly F. Sellers, Ph.D.. Department of Mathematics and Statistics. Georgetown University . Presentation Outline. Background distributions and properties. Poisson distribution. On a Mac. Create a Frequency Distribution. Refer to the tutorial creating a frequency distribution. Pie Chart. Highlight the columns of Political Affiliation and Percentage. Hold the control + alt button to highlight only these two columns. Prepared by: . Basem. Al . Mestadi. ID#200326870. What is flow Chart. Real work Example. Flow Chart . Conclusion. Outline. What is flow chart?. . is common type of chart, that represents an algorithm or process , showing the steps as boxes of various kinds, and their order by connecting these with arrows.. Bar chart used to display qualitative Data. Properties:. Bars do not touch. Bars are positioned in decreasing order. Ex: (#25, p 64). Use a Pareto chart to display the data. The data represent the results of a 2005 worldwide study of all airlines on the causes for baggage delay.. STEP 1: PREPARATION STEP 3: IMPREGNATION STEP 2: CLEANINGYour new LOWA boots are made of leather with exceptional properties: It is exible, durable and breathable. To make sure that the leather stays DRCUGANDAADJUMANIAMURUARUAKOBOKOMARACHAMOYOYUMBEKULUBAORABASALAM SALABIRJACOLEFORIGOBOROKERWAMENZEREBUSIABidibidiImvepiPalorinyaZ3Z4AZ5Z5Z3Z4Z1Z5Z2Z3Z55Z3Z4AZ3Z3Z4AZ1Z2Z3Z3Z3Z2Z1AZ1Z2Eden zoneTika zon Measure the circumference of your selected 31nger and use the below table to determine your size Band rings should 31t snugly at the base of the 31nger but wide enough to 31t over the widest part of t Raghu . Nandan. . Sengupta. Professor. Department of Industrial and Management Engineering. All figures are taken from(unless otherwise mentioned): . Introduction to Statistical process Control . Douglas. C Montgomery.
Download Document
Here is the link to download the presentation.
"LOWA SIZE CHART"The content belongs to its owner. You may download and print it for personal use, without modification, and keep all copyright notices. By downloading, you agree to these terms.
Related Documents