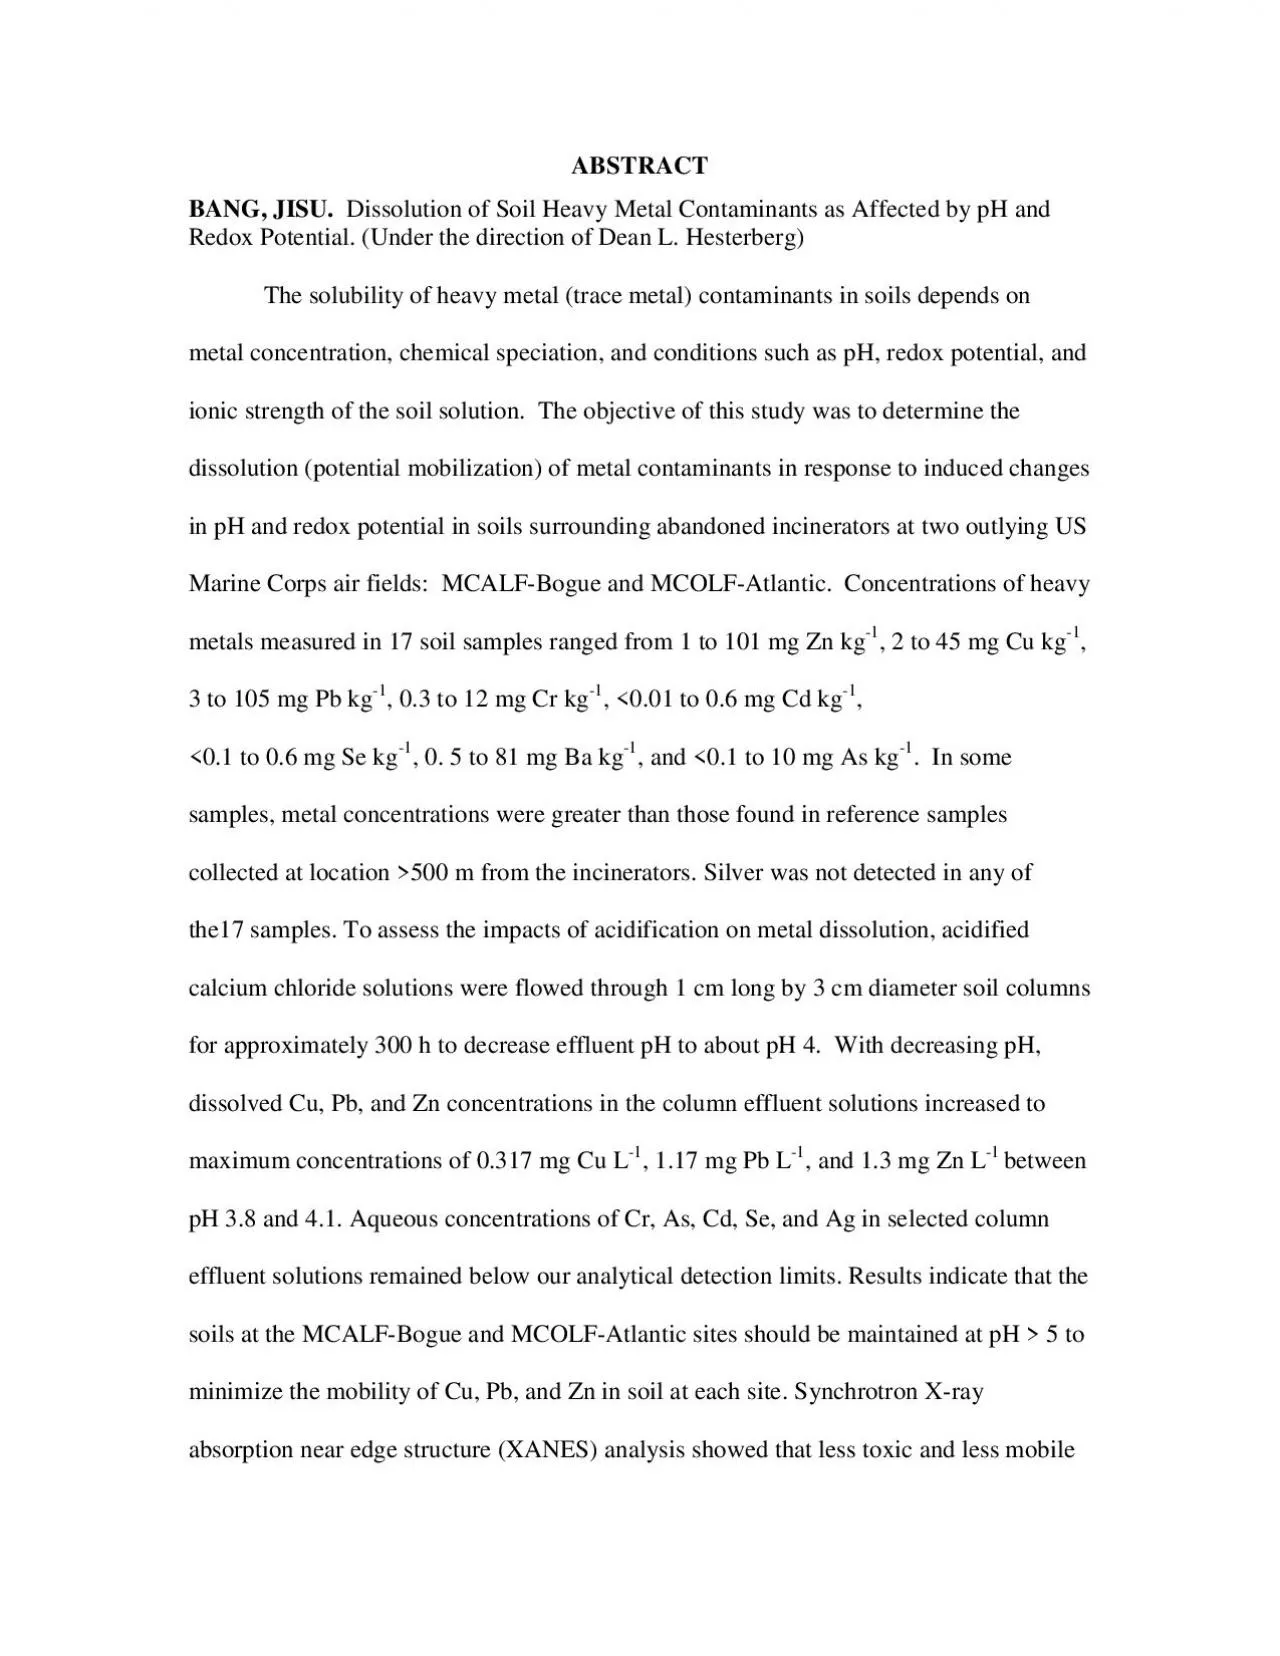
/
ABSTRACT BANG, JISU.  Dissolution of Soil Heavy Metal Contaminants as ABSTRACT BANG, JISU.  Dissolution of Soil Heavy Metal Contaminants as

ABSTRACT BANG, JISU. Dissolution of Soil Heavy Metal Contaminants as - PDF document

ash
ash . @ash
Follow
349 views
Uploaded On 2021-02-11

ABSTRACT BANG, JISU. Dissolution of Soil Heavy Metal Contaminants as - PPT Presentation

CrIII and AsV were dominant in soil at each site and that CrIII was not oxidized to CrVI by soil acidification in column flow experiments During 30 day redox incubation studies dissolved Zn ID: 831212

samples soil concentrations metal soil samples metal concentrations mcalf site dissolved column soils metals bogue mcolf figure incinerator heavy

Share:

Link:

Embed:

Download Presentation from below link

Download Pdf The PPT/PDF document "ABSTRACT BANG, JISU. Dissolution of Soi..." is the property of its rightful owner. Permission is granted to download and print the materials on this web site for personal, non-commercial use only, and to display it on your personal computer provided you do not modify the materials and that you retain all copyright notices contained in the materials. By downloading content from our website, you accept the terms of this agreement.


Presentation Transcript

ABSTRACT BANG, JISU. Dissolution of Soi
ABSTRACT BANG, JISU. Dissolution of Soil Heavy Metal Contaminants as Affected by pH and Redox Potential. (Under the direction of Dean L. Hesterberg) The solubility of heavy metal (trace metal) contaminants in soils depends on metal concentration, chemical speciation, and conditions such as pH, redox potential, and ionic strength of the soil solution. The objective of this study was to determine the dissolution (potential mobilization) of metal contaminants in response to induced changes in pH and redox potential in soils surrounding abandoned incinerators at two outlying US Marine Corps air fields: MCALF-Bogue and MCOLF-Atlantic. Concentrations of heavy metals measured in 17 soil samples ranged from 1 to 101 mg Zn kg, 2 to 45 mg Cu kg3 to 105 mg Pb kg, 0.3 to 12 mg Cr kg, 0.6 mg Cd kg Se kg, 0. 5 to 81 mg Ba kg, and As kg. In some samples, metal concentrations were greater than those found in reference samples collected at loca�.1 ;&#xto 1;� mg; .90;tion 500 m from the incinerators. Silver was not detected in any of the17 samples. To assess the impacts of acidification on metal dissolution

, acidified calcium chloride solutions w
, acidified calcium chloride solutions were flowed through 1 cm long by 3 cm diameter soil columns for approximately 300 h to decrease effluent pH to about pH 4. With decreasing pH, dissolved Cu, Pb, and Zn concentrations in the column effluent solutions increased to maximum concentrations of 0.317 mg Cu L, 1.17 mg Pb L, and 1.3 mg Zn L-1 pH 3.8 and 4.1. Aqueous concentrations of Cr, As, Cd, Se, and Ag in selected column effluent solutions remained below our analytical detection limits. Results indicate that the soils at the MCALF-Bogue and MCOLF-Atlantic �.1 ;&#xto 1;� mg; .90;sites should be maintained at pH 5 to minimize the mobility of Cu, Pb, and Zn in soil at each site. Synchrotron X-ray absorption near edge structure (XANES) analysis showed that less toxic and less mobile Cr(III) and As(V) were dominant in soil at each site, and that Cr(III) was not oxidized to Cr(VI) by soil acidification in column flow experiments. During 30 day redox incubation studies, dissolved Zn in aqueous suspensions reached a maximum concentration of 0.04 mg Zn L-1 as the redox potential decreased from 455 to as low a

s 250 mV (pH 7.7 0.2). Aqueous concentra
s 250 mV (pH 7.7 0.2). Aqueous concentrations of Cu, Pb, and Cr remained below our analytical detection limits. The results of laboratory mobility studies, along with the XANES results, indicated that trace metals in soils at the incinerator sites would remain immobile if the soil pH is maintained at� pH 5. Decreasing redox potential (Eh) if soil samples from at the MCALF-Bogue site to 250 mV caused minimal dissolution of Cu, Zn, Pb, and Cr. ii BIOGRAPHY JiSu Bang was born in S. Korea on September 20, 1974. The author graduated from Dan Kook University in 1996 with the B.S. degree in Biology In July 1999, the author moved to Raleigh, NC. The author entered the Soil Science Program at North Carolina State University and received a M.S. Degree in Soil Chemistry in 2002 under the direction of Dr. D. L. Hesterberg. iii ACKNOWLEDGMENT I would like to thank my major advisor Dr. Dean Hesterberg for entrusting this project to me over the past two years. His enthusiasm and encouragement of my efforts has been a great asset in my pursuit of the most applicable model. I would like to thank my committee

members, Dr. Stanley W. Buol and Dr. Way
members, Dr. Stanley W. Buol and Dr. Wayne P. Robarge, for their dedication to this study and for their professional and personal relations during the course of this project. Their comments and ideas have helped make this a great project. Thanks to the NCSU Department of Soil Science for providing me the opportunity to pursue my Masters degree in a warm and friendly atmosphere of academic excellence and for providing a place to call home. Thank you to Kim Hutchison for aiding me in my laboratory efforts and setting things in the right perspective. I am grateful to those who shared lab and office space with me (Laura Overstreet, Natasha Duarte, Daphine McKinney, Betsy Hutchison, and Nidhi Khare). Your friendship has been a valuable part of my experience at NC State. This research was carried out (in part) at the National Synchrotron Light Source, Brookhaven National Laboratory, which is supported by the U.S. Department of Energy, Division of Materials Sciences and Division of Chemical Science. I acknowledge that funding was provided by the US Department of the Navy through the US Marine Corps Air Station at Cher

ry Point, NC. Thank you to Major Ken Cob
ry Point, NC. Thank you to Major Ken Cobb from the Environmental Affairs Department at MCAS-Cherry Point for coordinating sample collection and for providing me with important information. Finally, to my family and my boyfriend, Jun Seop Jeong. Thank you for your love and support of my many adventures and dreams over the years. Thank you for always iv being there and sensing when I needed a little help and encouragement to see everything through. I couldn’t have done it without you. v TABLE OF CONTENTS Page LIST OF TABLES……………………………………………………………………….vii LIST OF FIGURES………………………………………………………….………….viii LIST OF APPENDIX FIGURES……………………………………………….…….…xii GENERAL INTRODUCTION…………………………………………………………...1 Introduction………………………………………………………………………..2 References…………………………………………………………………….…...6 CHAPTER ONE: SOIL CHARACTERIZATION……………………………………....8 Introduction…………………………………………………………………….….9 Materials and Methods…………………………………………………………...15 Soil Sampling and Characterization………………………………….…. 15 Sample Collection and Handling…..………………………….…15 Soil Properties……………………..……………………………..18 Soil Metal Charac

teristics………………………………………………..18 Heav
teristics………………………………………………..18 Heavy Metal Contents……………………………………………18 Analysis of Chromium and Arsenic Oxidation State……....…….20 General Characteristics…………………………………………………..22 Oxidation State of Chromium and Arsenic………………………………32 Soil Profile Geochemistry...……………………………………………...37 Reference………………………………………………………………………...49 CHAPTER TWO: COLUMN FLOW STUDIES….…………………………………….53 Introduction………………………………………………………………………54 Materials and Method……………………………………………………………58 Column Flow Study.……..………………………………………………58 vi Column System…………………………………………………..59 Effect of pH…………………………………………………..…..60 pH effects on chromium oxidation state……………...………………….62 Effects of reducing conditions on mobility of heavy metals..…………...65 Column Flow Study………………..…………………………………….67 Metal dissolution in soil samples from MCALF-Bogue...………67 Metal dissolution in soil samples from MCOLF-Atlantic….……79 Analysis of Chromium Oxidation State………………………………….89 Metal Dissolution as Affected by Redox Potential………………………92References...……………………………………………………………………...97 APPENDIX FIGURES……….………………………………………………………..100 vii LIST OF TABLE

S Table 1.1 Comparative costs for d
S Table 1.1 Comparative costs for different types of heavy metal soil remediation …………………………………………………………………3 Selected chemical, physical, and mineralogical properties of nine soil samples collected from the MCALF-Bogue incinerator site ……….……..24 Selected chemical, physical, and mineralogical properties of six soil samples collected from the the MCOLF-Atlantic incinerator site ….……...26 Table 1.3a Means and standard deviations of metal (metalloid) concentrations measured in nine soil samples collected from the MCALF-Bogue incinerator site……………………………………………………………..28 Table 1.3b Means and standard deviations of metal (metalloid) concentrations measured in six soil samples collected from the MCOLF-Atlantic incinerator site……………………………………………………………..30 Table 2.1 Summary of dissolved concentrations of selected metals in effluent samples of seven column flow experiments on soil samples from the MCALF-Bogue site….…………………………………………..77 Tabl

e 2.2 Summary of dissolved concentr
e 2.2 Summary of dissolved concentrations of selected metals in effluent samples of four column flow experiments on soil samples from the MCOLF-Atlantic site….………………….……………………..84 viii LIST OF FIGURES Figure 1.1General approaches to remediation of metals in soil – in-situ vs. ex-situ………………………………………………..2 Figure 1.2 pH dependent sorption of metal cations (Kinniburgh et al. 1976) and oxyanions (Leckie et al.,1980; Honeyman et al., 1984) by hydrous iron oxide gels (from Evanko et al., 1997)………..…………….…………….11 Figure 1.3 A pE-pH diagram showing the domain accessible to microorganisms (dashed perimeter) and that observed in soils (shade area) (Becking et al.,1960)………………………………………………………………….13 Figure 1.4 Locations of soil samples taken in December 1999 (in blue) and October 2000 (in red) from the MCALF-Bogue and MCOLF-Atlantic incinerator sites………………………………………………………….17 Figure 1.5 Stacked, normalized c

hromium K-XANES spectra
hromium K-XANES spectra for mixed Cr(VI)/Cr(III) standards diluted in boron nitride. The pre-edge peak at 5994 eV is absent in the Cr(III) standard [0 mol% Cr(VI)] and increases in intensity with increasing proportion of Cr(VI) in the Figure 1.6 Linear relationship between the integrated intensity of the Cr(VI) pre-edge peak in the K-XANES spectra and the proportion of Cr(VI) in physical mixtures of Cr(VI) (KCr(III) (Cr) standards…………………………………………….…...34 Figure 1.7 Stacked, chromium K-XANES spectra for soil samples collected at various depths from sampling locations around the incinerator at MCALF Bogue Site 27. A comparison with standards containing 0 or 10 mol% of total Cr as Cr(VI) indicated that Cr in the soil samples was Cr(VI)……………………………..…………35 Figure 1.8 Arsenic K-XANES spectra for soil samples collected from sampling locations around the incinerator at MCALF Bogue Site 27 as compared with As(III) and As(V) standards. Spectra for soil samp

les showed that As(V) was dominant………………
les showed that As(V) was dominant………………………………………..36 Figure 1.9 Relationship between soil chemical and mineralogical properties and the distribution of Cu, Zn, Pb, Cr, and As in soil samples at different depths from sampling location 1B (see Fig. 2) at the MCALF-Bogue incinerator Figure 1.10 Relationship between soil chemical and mineralogical properties and the ix distribution of Cu, Zn, Pb, Cr, and As in soil samples at different depths from sampling location 2 (see Fig. 2) at the MCALF-Bogue incinerator Figure 1.11 Relationship between soil chemical and mineralogical properties and the distribution of Cu, Zn, Pb, Cr, and As in soil samples at different depths from sampling location 3 (see Fig. 2) at the MCALF-Bogue incinerator Figure 1.12 Relationship between soil chemical and mineralogical properties and the distribution of Cu, Zn, Pb, Cr, and As in soil samples at different depths from sampling locat

ion 4 (see Fig. 2) at the MCALF-Bogue in
ion 4 (see Fig. 2) at the MCALF-Bogue incinerator Figure 1.13 Relationship between soil chemical and mineralogical properties and the distribution of Cu, Zn, Pb, Cr, and As in soil samples at different depths from sampling location 1 (see Fig. 2) at the MCOLF-Atlantic incinerator Figure 1.14 Relationship between soil chemical and mineralogical properties and the distribution of Cu, Zn, Pb, Cr, and As in soil samples at different depths from sampling location 2 (see Fig. 2) at the MCOLF-Atlantic incinerator Figure 1.15 Relationship between soil chemical and mineralogical properties and the distribution of Cu, Zn, Pb, Cr, and As in soil samples at different depths from sampling location 3 (see Fig. 2) at the MCOLF-Atlantic incinerator Figure 1.16 Relationship between soil chemical and mineralogical properties and the distribution of Cu, Zn, Pb, Cr, and As in soil samples at different depths from sampling locati

on 4 (see Fig. 2) at the MCOLF-Atlantic
on 4 (see Fig. 2) at the MCOLF-Atlantic incinerator Figure 2.1 Schematic diagram of the overall column flow system used to study soil metal mobility as affected by pH.………………………………..…..58 Figure 2.2 Schematic diagram showing details of a soil column for the flow experiments……………………………………….………..59 Figure 2.3 Schematic diagram illustrating the steps to preparing a soil column for column flow experiments……………………………………….……60 Figure 2.4Typical sequence of electrolyte solutions flowed through each column in the experiments to evaluate pH effects on metal dissolution ...………..61 Figure 2.5 Schematic diagram of soil subsamples for Cr K-XANES analysis to determine sample heterogeneity.…………………………………...……..63 Figure 2.6 Schematic diagram for subsampling and column packing for the Cr(III) oxidation experiment ……………….…………………….64Figure 2.7 Schematic diagram for the microbial reduction experiment with different times of reduction …………………

………………….……65 Figure 2.8a Dissolved c
………………….……65 Figure 2.8a Dissolved concentrations of copper, chromium, lead, iron, manganese, and zinc in effluent solutions collected during a column flow experiment on a soil sample from the window site, MCALF-Bogue …………………………………………………………68 Figure 2.8b Dissolved concentrations of arsenic, barium, cadmium, selenium, and silver in effluent solutions collected during a column flow experiment on a soil sample from the window site, MCALF-Bogue …………………..………………………………………69 Figure 2.9a Dissolved concentrations of copper in effluent solution for column flow experiments on four replicate samples from near the incinerator entrance at MCALF-Bogue……………………70 Figure 2.9b Dissolved concentrations of zinc in effluent solutions for column flow experiments on four replicate samples from near the incinerator entrance at MCALF-Bogue……………………70 Figure 2.10 Dissol

ved Cu in column effluent solutions for
ved Cu in column effluent solutions for soil samples taken near the incinerator window (AW) and location 1A (120-150 cm) at MCALF- Bogue, as affected by pH……………………………………71 Figure 2.11 Dissolved Pb in column effluent solutions for soil samples taken near the incinerator window (AW2) and location 1A (38-70 cm) at MCALF- Bogue, as affected by pH……………………………………72 Figure 2.12 Dissolved Zn in column effluent solutions for soil samples taken near the incinerator window (AW2) and location 1A (38-70 cm) at MCALF- Bogue, as affected by pH……………………………………73 Figure 2.13 Dissolved concentrations of copper, lead, zinc in effluent solutions for a column flow experiment on a sample from near the incinerator window at MCALF-Bogue …………..………..…………………………74 xiFigure 2.14a Dissolved concentrations of copper, chromium, lead, iron, manganese, and zinc in effluent solutions collected from a column flow

experiment on a soil sample f
experiment on a soil sample from near the incinerator entrance at MCOLF -Atlantic………...………………………….…………………80 Figure 2.14b Dissolved concentrations of arsenic, barium, cadmium, selenium, and silver in effluent solutions collected from a column flow experiment on a soil sample from near the incinerator entrance at MCOLF -Atlantic.………...……………………………………………81 Figure 2.15 Dissolved concentrations of copper, lead, zinc in effluent solutions for a column flow experiment on a sample from near the incinerator entrance at MCOLF-Atlantic…………….………………………..………82 Figure 2.16a The relationship between soil Cu concentrations and dissolved Cu Figure 2.16b The relationship between soil Zn concentrations and dissolved Zn Figure 2.17 Stacked, chromium K-XANES spectra for soil samples collected from column studies on pH effects on Cr(III) oxidation………………………..89 Figure 2.18 Stacked, chromium K-XANES spectra for soil samples collected fro

m column studies
m column studies on pH effects on Cr(III) oxidation………………….…….91 Figure 2.19 Dissolved Cu, Pb, Zn, Cr, Fe, and Mn concentrations in suspensions from five selected soil samples at MCALF-Bogue, after 0, 10, 20, and 30 day incubations with 0.2% dextrose………………………………………94 xiiLIST OF APPENDIX FIGURES Figure A.1Dissolved [Cu] in effluent samples collected from columns of soils from the MCALF-Bogue site as a function of pH………..……………100 Figure A.2Dissolved [Cu] in effluent samples collected from columns of soils from the MCOLF-Atlantic site as a function of pH………..…………..102 Figure A.3Dissolved [Zn] in effluent samples collected from columns of soils from the MCALF-Bogue site as a function of pH………..……………103 Figure A.4Dissolved [Zn] in effluent samples collected from columns of soils from the MCOLF-Atlantic site as a function of pH………..……….…105 Figure A.5Dissolved [Pb] in effluent samples collected from columns of soils from

the MCALF-Bogue site as a function of p
the MCALF-Bogue site as a function of pH………..……………106 Figure A.6Dissolved [Pb] in effluent samples collected from columns of soils from the MCOLF-Atlantic site as a function of pH………..………….107 GENERAL INTRODUCTION INTRODUCTION Contamination of soil by metals is an important environmental concern because it may lead to human exposure, ecotoxicology, and water contamination. Furthermore, because heavy metal contaminants do not undergo degradation, they must be managed indefinitely. (Since the term "heavy metal" has generally been used in various publications related to metal remediation, the term heavy metal is used in this thesis instead of the term trace metal defined by IUPAC). Traditional approaches to remediation of metal contamination in soils have generally involved ex-situ treatments using physical removal of contaminated material to offsite locations (Figure 1.1). Although advantages of ex-situ technologies include the relatively rapid and complete removal of contaminants (Wood, 1997), these approaches have several limitations such as a relatively high cost, the risk

of spreading contaminated materials duri
of spreading contaminated materials during removal of contaminated soil, the limited capabilities of landfills, and Figure 1.1.General approaches to remediation of metals in soil – in-situ vs. ex-situ (Federal Technology Center, 1997) Heavy Metal Contaminated soilEx-Situ (Excavate)Process Treatment In-Sit(Treat) Stabilized Reuse for ConstructionRetain at Original Location the disruptive site-excavation activities. Efforts to alleviate the high cost, reduce risk associated with excavation activities, and eliminate the need to relocate wastes to offsite locations have led environmental scientists to consider in-situ remediation techniques (Figure 1.1). In-situ treatment of contaminated soil is often more cost- effective. Table 1.1 indicates that the costs of managing the soil by in-situ fixation may be about half the cost of remediating contaminated soils by excavation, and is also relatively rapid. Total metal concentration does not adequately identify the risk of a given metal in soils (McGrath, 1994, Schmidt, 1997) because metals in soils tend to exist primarily in non-mobile fractions (Shum

an, 1991). Chemical forms (speciation) o
an, 1991). Chemical forms (speciation) of metals may in response to changes in soil properties such as pH and redox conditions. A main concern with treating the metals in situ is that they may become mobile and more bioavailable as soil conditions change (Gambrell, 1994, Tack et al., 1996, Calmano et al., 1993). A basic sound understanding of trace metal speciation and long-term impacts of soil chemical changes on metal dissolution needed for developing successful remediation technologies. The solubility of heavy metal contaminants in soils depends on chemical speciation of the metal, and the pH and redox potential of the surrounding soil. The Table 1.1. Comparative costs for different types of heavy metal soil remediation solubility of heavy metals has been shown to be closely related to pH (Zhu and Alva, 1993; Basta and Tabatabai, 1992; Adriano, 1986) and to changing redox potential (Calmano et al., 1994; Tack et al., 1996; Chuang et al., 1996). Acidity is a main factor that controls metal mobility in soils. For example, metal cation solubility typically increases with decreasing pH. As pH decreases,

the solubility of metal cations typicall
the solubility of metal cations typically increases due to desorption from soil mineral surfaces or organic matter. Also, the solubility of minerals such as metal oxides, hydroxides, and carbonates increases with deceasing pH. Oxyanion solubility typically decreases with decreasing pH. In addition, redox status affects the behavior of metals. As long as reducing conditions exist, sulfide precipitates may immobilize metals (Gambrell, 1994). When reducing conditions cause the dissolution of hydrous Mn, Al, and Fe oxides, their co-precipitated metals are released into the soil solution (Sposito, 1983), until the redox potential is low enough to form metal sulfide precipitates. Soils surrounding two old abandoned waste incinerator sites at the US Marine Corps air fields- Marine Corps Auxiliary Landing Field (MCALF)-Bogue Site 27 and Marine Corps Outlying Landing Field (MCOLF)-Atlantic Site 25 -in eastern North Carolina were assumed to be contaminated with trace metals due to ash deposition from the incinerators and waste spillage. For potential risk assessment in metal contaminated soils, the characterization o

f metal mobility in soils is of fundamen
f metal mobility in soils is of fundamental importance. Since the pH and redox conditions are of prime importance in determining the solubility and mobility of heavy metals in soils, we designed laboratory experiments to measure the dissolution of heavy metals in soils from these sites as affected by changes in pH or redox conditions. The goal of this research was to provide information on heavy metal concentrations and mobility in soils at two incinerator sites to aid in designing appropriate and cost-effective remedial actions. The aim was to determine the range of soil pH and Eh conditions that must be maintained to minimize the mobility and potential toxicity of any heavy metals in soils surrounding abandoned incinerators at two outlying US Marine Corps air fields: MCOLF-Atlantic and MCALF-Bogue. The specific objectives of this study were 1. To characterize the concentrations of soil heavy metals, and soil properties controlling the mobility and potential toxicity of metals at the two incinerator sites (Chapter 1). 2. To determine the dissolution (potential mobilizati

on) of metals in soil samples from the s
on) of metals in soil samples from the sites in response to induced changes in pH and redox REFERENCE Adriano, D.C. 1986. Trace Elements in the Terrestrial Environment. Springer-Verlag, Basta, N.T. and M.A. Tabatabai. 1992. Effect of cropping systems on adsorption of metals by soils: II. Effect of pH. Soil Sci. 153:195-204. Calmano, W. J. Hong, and U. Forstner. 1993. Binding and mobilization of heavy metals in contaminated sediments affected by pH and redox potential. Water Sci. Tech. 28:223-Chuang, M.C., G.Y. Shu, and J.C. Liu. 1996. Solubility of heavy metals in a contaminated soil: Effects of redox potential and pH. Water Air Soil Pollut. 90:543-556. FETC (Federal Energy Technology center). 1997. Stabilization and Reuse of Heavy Metal Contaminated Soil by Means of Quicklime-Sulfate. http://www.earthvision.net /industryprograms/pdfs/sc/29117.pdf (October, 1997) Gambell, R.P. 1994. Trace and toxic metals in wetlands- a review. J. Environ. Qual. McGrath S.P. 1994. Effects of heavy metals from sewage sludge on soil microbes in agriculture ecosystem. In: Ross SM (ed) Toxic metals in soil-plant system. John

Wiley & Sons, New York, NY, p. 247-274.
Wiley & Sons, New York, NY, p. 247-274. Schmidt J.P. 1997. Understanding phytotoxicity thresholds for trace elements in land-applied sewage sludge. J. Environ. Qual. 26:4-10. Schnoor, J. 1997. Phytoremediation: Groundwater Remediation Technologies Analysis Center Technology Evaluation Report TE-98-01, 37. Shuman, L.M. 1991. Chemical forms of micronutrients in soils. R. Luxmoore (ed.) ed. SSSA Book Ser. 4. SSSA, Madison WI. p. 113-144 Sposito, G. 1983. The chemical forms of trace metals in soils. p.123-170. In “Applied Environmental Geochemistry”. (Ed). Thornton, I. Academic Press Inc. London. Tack, F.M., O.W.J.J. Callewaert, and M.G. Verloo. 1996. Metal solubility as a function of pH in a contaminated, dredged sediment affected by oxidation. Environ. Poll. Wood, P., 1997. Remediation methods for contaminated sites: in R.Hester and R.Harrison, Contaminated Land and Its Reclamation, the Royal Society of Chemistry, Cambridge, p.47-71. Zhu, A., and A.K. Alva. 1993. Distribution of trace metals in some sandy soils under citrus production. Soil Sci. Soc. Am. J. 57:350-355. CHAPTER ONE: SOIL CHARACTERIZATION INT

RODUCTION The long-term reactivity, bioa
RODUCTION The long-term reactivity, bioavailability, and mobility of heavy metal contaminants in soils are of major environmental concern to modern society. The most common metals found at contaminated sites were listed by the US Environmental Protection Agency (EPA) (1996), in order; lead (Pb), chromium (Cr), arsenic (As), zinc (Zn), cadmium (Cd), copper (Cu), and mercury (Hg). Heavy metal contamination in soils is primarily caused by metal smelting and mining, metal manufacturing, and metal-contaminated wastes (e.g. paints, batteries, industrial waste, and sludge applications). Soil Pb contamination resulted from the former use of lead in gasoline. Metals (and metalloids) typically are present in soils as either cations such as Pb, Znor oxyanions such as CrO. Lead, zinc, and copper in soils usually occur in the +2 oxidation state and form aqueous complexes with inorganic (Cl) and organic ligands (humic and fulvic acids, amino acids) (Bodek et al., 1988). The primary processes responsible for the solid-phase forms of these metal cations in soils include adsorption, ion exchange, precipitation with sulfides,

carbonates, hydroxides and other anions
carbonates, hydroxides and other anions (as free precipitates, surface precipitates, or coprecipitates), and complexation with organic compounds (Alloway, 1995 and Brown et al., 1999). High soil pH favors adsorption of metal cations and precipitation as oxides, hydroxides, and carbonates. Therefore, metal cations are typically mobile under acidic conditions. For example, figure 1.2a shows the selectivity sequence for the sorption of heavy metal cations onto Fe oxide as a function of pH (Kinniburgh et al. 1976). Cu and Pb are less soluble at the lower pH than Zn and Cd. Zinc is one of the most mobile heavy metals in soils because it is present as soluble compounds under neutral and acidic conditions. Soil 10organic matter is also critical in heavy metal retention. With increasing organic carbon, soil retention capacity can increase, and metal ions, especially, Cube strongly bound to the organic matter. Soil organic matter can be more important in the retention of Pb and Cu than precipitation as the carbonate or sorption by hydrous oxides (Zimdahl and Skogerboe, 1977). However, an increase of the soil o

rganic matter content can also cause an
rganic matter content can also cause an increase of dissolved organic matter contents that leads to an increase in the concentrations of heavy metals in soil solution (Dunnivant et al., 1992). Hg, Cu, Pb, and Zn are classified as chalcophiles and may form extremely insoluble sulfide minerals under soil conditions that are sufficiently reducing to convert any sulfate to sulfides (McBride, 1994). Therefore, these metals may have very low solubility in Some elements such as As, Se, and Cr change oxidation states in soils. These elements mainly occur as oxyanions of arsenate, chromate, and selenite under typical soil pH and redox conditions. Since adsorption, solubility of precipitates, and aqueous complexation characteristics of metals change with the oxidation states, the redox condition in soils influences the fate of trace metals to a great extent (Schaller et al., 1997). As such, the mobility of these elements depends on their oxidation state. For many oxyanions, low pH favors adsorption (Figure 1.2b) or precipitation. Chromium, occurring as Cr(VI) or Cr(III), has a variety of different chemical, biologi

cal, and environmental properties in nat
cal, and environmental properties in natural environments. Cr(VI) is more toxic and mobile than Cr(III). Arsenite (AsO) is also more toxic than arsenate (AsO). Fortunately, arsenate is the dominant species in oxygenated systems and has a low mobility in 11Figure 1.2. pH dependent sorption of metal cations (Kinniburgh et al. 1976) and oxyanions (Leckie et al., 1980) by hydrous oxides gels of iron (from Evanko et al., Total component sorbed(%) 12oxidized soil environments due to its likely retention on Fe- and Al-oxide mineral surfaces. Furthermore, such retention reactions may also help to restrict reduction reduction of As(V) to As(III) under reducing conditions (McGeehan and Naylor, 1994). Assessing the environmental impacts of chromium and arsenic in soils should involve determining the amount and species of Cr and As present in each oxidation state, along with the total amount of Cr and As present. Accurate information on the chemical forms (including oxidation state) and mobility of these elements in soils is therefore vital to assessing the hazard that the contaminants represent, and it can

also guide the choice of remediation tec
also guide the choice of remediation technologies. The main factors that influence the mobility of heavy metals in soils include organic carbon content, Fe, Mn, and Al oxide contents, pH, and redox potential (Gambell, 1994). Soils high in clays, oxide minerals, or organic matter strongly retain most trace metals (McBride, 1994). For example, soil organic matter can strongly bind metal cations (Aastrup et al., 1991). Organic matter forms complexes with metal cations by ion exchange and chemisorption reactions. Metal cations bond with carboxyl, phenol, alcohol, carbonyl, and methoxyl functional groups (McBride, 1994). Except for aqueous complexation with dissolved organic matter, complexation with organic matter typically contributes to the decrease of the mobility of metals. Iron-, manganese- and aluminum- oxides also provide chemisorption sites for both cations and oxyanions. Therefore, the presence of hydrous metal oxides of Fe, Al, and Mn can strongly influence dissolved metal concentrations because these minerals can remove cations and oxyanions from solution by ion exchange, specific adsorption (chemi

sorption) and surface precipitation (Ell
sorption) and surface precipitation (Ellis and Fogg, 1985; Dzombak and Morel, 1987). A majority of heavy metals is 13considered to be bound to oxide minerals by chemisorption due to the exchange of heavy metal cations and oxyanions with surface protons or hydroxyls to form partly covalent bonds with lattice ions (Alloway, 1995). The mobility of heavy metals can be reduced in soils via reactions such as co-precipitation. Such reactions can retard the migration of metals and also provide a long-term source of metal contaminants (NRC, 1994). As discussed in detail in Chapter 2, adsorption and precipitation reactions involving heavy metals are affected by pH and redox potential. Figure 1.3 shows the range of Eh and pH in soils. These chemical +10 pE Eh 024Figure 1.3 A pE-pH diagram showing the domain accessible to microorganisms (dashed perimeter) and that observed in soils (shade area) (modified from Sposito, 1989). 14conditions can also change faster than other factors such as soil texture and composition. Natural or accelerated soil acidification can make metal cations more mobile. Sorption of meta

l cations and precipitation as oxides, h
l cations and precipitation as oxides, hydroxides, and carbonates decreases with decreasing pH. In contrast, metal desorption from soil binding sites into solution is stimulated due to H competition for binding sites in acidic soils. Redox reactions can be important in altering the mobility and toxicity of inorganic and organic contaminants through changing oxidation states, pH, and altering soil matrix constituents (e.g., reductive dissolution of Fe-oxides). We investigated two abandoned incinerator sites at MCOLF-Atlantic Site 25 and MCALF-Bogue site 27, which are located in the coastal plain of North Carolina. The main environmental concern at these sites was the potential for heavy metal contamination due to past waste incineration practices. To evaluate the levels of heavy metal contamination and soil properties controlling the mobility and potential toxicity of metal contaminants, we examined chemical and mineralogical properties of soils from the sites, including heavy metal concentrations, pH, indicators of redox potential (color), oxidation states of Cr and As, extractable Fe, Mn, and Al, and total

and organic carbon contents. This chapt
and organic carbon contents. This chapter reports metal concentrations, soil characteristics, and oxidation states of chromium and arsenic in soil samples from these sites. The objective of the research reported here was to determine relationships between the soil properties and the distribution of metals within soil profiles sampled at each incinerator site, and to determine whether any specific soil properties could be identified that apparently controlled the potential mobility of metals in these soils. 15MATERIALS AND METHODS Soil Sampling and Characterization Sample collection and handling Soils at two former incinerators - Marine Corps Outlying Landing Field (MCOLF)-Atlantic Site 25 and Marine Corps Auxiliary Landing Field (MCALF)-Bogue Site 27 -associated with the Marine Corps Air Station (MCAS) in Cherry Point, NC were investigated. The sites are located in Carteret County in the coastal plain of North Carolina (Figure 1.3). Poorly drained and very poorly drained soils such as Leon (sandy, siliceous, thermic Aeric Alaquods) and Murville (sandy, siliceous, thermic, Umbric Endoaquods) soils wer

e mapped in the vicinity of the MCOLF-At
e mapped in the vicinity of the MCOLF-Atlantic site. Well-drained and moderately well drained soils such as Wando (thermic, coated Typic Quartzipsamments) soils were mapped in the vicinity of the MCALF-Bogue site. Seventeen soil samples were collected on October 23, 2000 from around and inside abandoned incinerators at each site (Figure 1.4). The sampling locations and depths were selected based on locations having higher concentrations of some of the US-EPA priority contaminants (e.g. As, Cu, Pb, Zn, Cd, Cr, Ag, and Se) as measured in samples collected in October 1999 (Hesterberg, 2001). Soil samples were also collected from near the windows and entrance of the incinerators at each site. These samples were expected to contain higher concentrations of metals because waste materials and ashes were possibly transferred into and out of the incinerators through the entrance and window. Also, a composite sample was taken from inside each incinerator for determining metal concentrations only. Samples of reference soil samples for “background” metal 16concentrations were taken about 2000 feet to the northwes

t of the MCALF-Bogue incinerator. Refere
t of the MCALF-Bogue incinerator. Reference soil samples from MCOLF-Atlantic were taken about 500 feet to the northeast of the incinerator. To reduce microbial activity that could alter the samples’ redox state, all samples were placed on ice in the field, transported, and stored on ice or under refrigeration (4C) for the duration of the study. In the laboratory, all sample handling was done in a glove box under an oxygen-free, Ar(g) atmosphere and a safe light to try to minimize changes in sample redox potential. Plant roots and gravel were removed by sieving soil samples to m using a stainless steel screen. To achieve homogenized soil samples, each sample was well mixed in a plastic bucket using a polypropylene-mixing blade on a rotary motor. The homogenized samples were divided and sealed under Ar(g) into amber–colored borosilicate glass bottles with Teflon-coated rubber seal inserts and crimp caps. All labware used for sampling was pre-washed with 6 M HNO3 solution. 17Carteret County MCALF MCOLF -Atlantic site25 MCALF (AIC) inside incinerator MCALF WINDOW (AW)

5' from window MCALF WINDO
5' from window MCALF WINDOW (AW2) 5' from window MCALF ENTRANCE (AE) 2' 6" from entrance MCALF LOCATION 1A (A1A) 13' from building MCALF LOCATION 2 (A2-0) 11' from building MCALF LOCATION 1B 8' from building MCALF LOCATION 2 9' from building MCALF LOCATION 3 13' from building MCALF LOCATION 4 11' from building MCOLF (OIC) inside incinerator MCOLF WINDOW (OW) 2' 4" from window MCOLF ENTRANCE (OE) 1' 3" from entrance MCOLF LOCATION 2 (O2-70) 5' 6" from settling tank MCOLF LOCATION 4 (O4-0) 10' from building MCOLF LOCATION 1 11'6" from building MCOLF LOCATION 2 5' 6" from settling tank MCOLF LOCATION 3 14' from building MCOLF LOCATION 4 10' from building Figure 1.4. Locations of soil samples taken in December 1999 (in blue) and October 2000 (in red) from the MCALF-Bogue and MCOLF-Atlantic incinerator sites. MCALF Bogue site 27WINDOW ENTRANCE MCA

LF LOCATION MCALF LOCATION 2INCINERATOR
LF LOCATION MCALF LOCATION 2INCINERATOR A2-0A1A –38 A1A –70 A1A –120CEMENT MCALF LOCATION 3 MCALF LOCATION 4MCALF LOCATION 1BWINDOW ENTRANCE MCOLF LOCATION 3MCOLF Atlantic site 25MCOLF LOCATION 4 MCOLF LOCATION 2 OW OE Settling tank OIC INCINERATOR MCOLF LOCATION 1 18Soil PropertiesTo characterize soil samples from the two abandoned incinerator sites, we determined chemical and mineralogical properties including pH, soil color (indicator of redox potential), extractable Fe, Mn, and Al, chemical speciation (oxidation states of Cr and As), and total and organic carbon contents (Table 1.2a, 1.2b). The pH of the soil was measured using a 1:1 soil:water ratio (Thomas, 1996). Soil color was determined by comparing moist soil samples with the chips of Munsell Soil Color Charts (Munsell Color Co., 1975) in the laboratory. Frequently, soil color provides a good indication of redox status, with yellow and red colors indicating oxic conditions, and blue-green and grey colors indicate more reducing conditions. Citrate-dithionite-bicarbonate (CBD) extraction was used to extract Fe (Fe), Al (Al) and Mn (Mn) (Jac

kson et al., 1986). According to Jackson
kson et al., 1986). According to Jackson et al. (1986), CBD is a good extracting agent for crystalline and non-crystalline hydrous Fe oxides, Fe associated with soil organic matter, non-crystalline Al hydrous oxides, and Al associated with organic matter. Acid ammonium oxalate (0.2 M) at pH 3.0 and in the dark (Jackson et al., 1986; Taylor and Schwertmann, 1974) was used to extract organic matter bound to Fe, non-crystalline Fe, portions of magnetite and maghemite, organic matter bound to Al and non-crystalline Al. The ratio of oxalate-Fe ) to CBD-Fe (Fe), Fe, was used as a relative measure of the degree of aging or crystallinity of the Fe oxides (McKeague and Day, 1966). As Schwertmann (1993) noted, , when analyzed with Fe, can give a measure of the activity of the Fe oxides. Organic carbon contents were determined by the Walkley-Black method (Walkley and Black, 1934). Total carbon content was determined by combustion on a Shimadzu (PE 2400 CHN Elemental Analyzer, Perkin-Elmer Corp., Norwalk, CT). 19Soil Metal Characteristics Heavy Metal Contents Concentrations of arsenic (As), barium (Ba), cadmi

um (Cd), chromium (Cr), lead (Pb), selen
um (Cd), chromium (Cr), lead (Pb), selenium (Se), silver (Ag), mercury (Hg), copper (Cu), zinc (Zn), iron (Fe), and manganese (Mn) in soil samples from the MCOLF-Atlantic Site 25 and the MCALF-Bogue site 27 (Table 1.3a, 1.3b) were determined by acid digestion using the following US-EPA SW-846 3050 analysis series (“Solid Analytical Method- Preparation and Analysis”) (Wagner, 1996; pp. 65-74; 116): SW-846 3050/6010 for inductively coupled plasma-optical emission (ICP-OES) spectrometry; SW-846 3050/7190 for Cr, /7210 for Cu, /7380 for Fe, /7460 for Mn and /7950 for Zn, all using flame atomic absorption spectrometry (AAS). The digestion of soil samples and the analysis of metals using AAS (Perkin Elmer Model 3100 Spectrometer) or ICP-OES (Perkin Elmer Emission Spectrometer Model 2000) were performed within the maximum (EPA) holding time of 6 months. Method detection limits and limits of quantitation were determined for each instrument and preparative method. Soil samples were selected at random for digestion in batches of 20 to 25 samples each, until triplicate subsamples of each sample had been digested. For

quality control of the digestion procedu
quality control of the digestion procedure, three method blanks, duplicate matrix spikes, and triplicate samples of Standard Reference Material (NIST Soil Standard - 2710 Montana Soil) from the National Institute of Standards and Technology were included in each set of soil sample digests. Digestions were done using “trace metal” grade HCl and (Fisher Scientific, Pittsburgh, PA). The detailed digestion procedures are 20described in the US-EPA SW-846 3050 analysis series (Wagner, 1996). Solutions from digested soil samples were stored in 125 mL, high –density polyethylene (HDPE) sample bottles at 4C until they were analyzed. Concentrations of As, Ba, Cd, Se, and Ag were measured using ICP-OES. Concentrations of Cu, Zn, Pb, Cr, Fe, and Mn were determined by FAAS. Also, Hg analyses on selected moist soil samples were performed using Neutron Activation Analysis (NAA) (Helmke, 1996) at NC State Nuclear Reactor, within 28 days of sample collection. Analysis of Chromium and Arsenic Oxidation StateSynchrotron x-ray absorption near edge structure (XANES) analysis is useful for determining the oxidation state of e

lements such as Cr and As that occur in
lements such as Cr and As that occur in multiple oxidation states in soils (Lee et al., 1995; Szulczewski et al., 1997; Schulze et al., 1995). XANES spectroscopy was conducted to determine the oxidation state of chromium and arsenic in selected field-moist soil samples from the MCALF-Bogue and the MCOLF-Atlantic sites in order to assess the potential hazards of these elements in the soils (Figures 1.4-1.7). XANES data collection was done at Brookhaven National Laboratory (BNL) using synchrotron radiation generated at the National Synchrotron Light Source (NSLS). The principles and procedures for collecting and analyzing XANES data were described by Sayers and Bunker (1988), Fendorf and Sparks (1996), and Fendorf (1999). Approaches and applications of x-ray absorption spectroscopy to determining the speciation of heavy metals in geochemical systems (soils and groundwater aquifer matrices) were given by Wang et al. (1998) and Hesterberg et al. (1997). 21Moist soil samples and standard mineral samples were mounted in polyacrylamide sample holders for XANES analysis. Mounting of soil samples was done 2(g) atmos

phere. Samples were held in the sample
phere. Samples were held in the sample holders using KAPTON tape. To calibrate the XANES spectra with respect to Cr(VI) and Cr(III), mineral standards of Cr(VI) (K) and Cr(III) (Cr) were physically mixed in various proportions to yield 0, 10, 50, and 100 mol% Cr(VI) [100 x moles Cr(VI)/total moles Cr]. These standards were diluted in boron nitride (BN) to 350 mmol Cr kg, because BN has as low x-ray absorption coefficient. These standard samples (of higher Cr concentration) were analyzed in transmission mode. Fluorescence mode detection using a 13-element detector was used for soil samples of low Cr content. The 170.1 m circumference x-ray storage ring normally operates at 2.584 GeV. Beamline X-11-A uses a double flat-crystal with a resolution of 2x10E/E. For Cr, 40% detuning of the during data collection was used, which was sufficient to eliminate third and higher order harmonics. All XANES spectra at As K-edge (11,870 eV) were also conducted on NSLS x-ray beam line X-11A using transmission mode for standards of As [As(III)] and [As(V)] and fluorescence mode detection for soil samples of low As content. T

he monochromator was detuned 30% for As
he monochromator was detuned 30% for As data collection. All XANES spectra were linear baseline and single-point background corrected using the computer software Kaleidagraph program (Synergy Software, Reading, PA), following procedures of Sayers and Bunker (1988). 22RESULTS AND DISCUSSION Soil Characteristics Tables 1.2a and 1.2b show selected properties of soil samples from the MCALF-Bogue and MCOLF-Atlantic sites, including color, pH, carbon content, and extractable iron, manganese and aluminum concentrations. The colors of soil samples from the MCALF-Bogue sites were remarkably different from those for the MCOLF-Atlantic sites. Samples from the MCALF-Bogue site were typically brown or yellowish brown in color, except for the black reference soil samples (Table 1.2a). Soil samples from the MCOLF-Atlantic site were all very dark gray or black in color (Table 1.2b). The concentrations of CBD-extractable Fe were typically lower in samples from the MCOLF-Atlantic site (102 to 2,850 mg Fe kg) compared with those from the MCALF-Bogue site (4,400 to 9,900 mg Fe kg), indicating lower concentrations of Fe–oxide m

inerals at the MCOLF-Atlantic site (Tabl
inerals at the MCOLF-Atlantic site (Table 1.2a, 2b). The greater oxalate- to CBD-extractable Fe ratio for samples from the MCOLF-Atlantic site (Fe=0.2 to 0.4) compared with samples from the MCALF-Bogue site (Fe/Fe=0.07 to 0.1) indicated a greater proportion of less stable, poorly crystalline Fe-oxides at the MCOLF-Atlantic site. At the MCALF-Bogue site, Fe/Fe ratios indicated that more crystalline Fe-oxides were present, and the soil colors suggested that goethite was the dominant Fe-oxide mineral. The yellowish to brown color, high concentration of CBD-extractable Fe, and low oxalate- to CBD-extractable Fe ratio at the MCALF-Bogue site were indicative of well-drained soil and more oxidizing redox conditions. The low-chroma soil colors, low concentrations of CBD-extractable Fe, and high ratios of oxalate- to CBD-extractable Fe at the MCOLF-Atlantic site are indicative of poorly drained soil conditions and more active redox 23processes (Schwertmann, 1993). The organic carbon contents of soil samples were typically lower in samples from the MCALF-Bogue site (0.07 to 0.7 % w/w) than in samples from the MCOLF-At

lantic site (0.2 to 3.1% w/w). The high
lantic site (0.2 to 3.1% w/w). The higher content of organic carbon in samples from the MCOLF-Atlantic site compared with the MCALF-Bogue site (Table 1.2a, 1.2b) suggests that organic matter may have accumulated due to reduced redox conditions. The pH values of soil samples from the MCALF-Bogue site ranged from pH 5.4 to 8.1 (mean soil pH = 7.2 ± 0.9). Wando soils mapped in the vicinity of the MCALF-Bogue site have reported pH ranging from 5.6 to 7.3. The soil samples from the MCOLF-Atlantic had pH ranging from 5.8 to 7.6 (mean soil pH = 6.3 ± 0.8). Leon and Murville soils mapped in the vicinity of the MCOLF-Atlantic site are classified as extremely acid to slightly acid, meaning that pH ranges from pH 3.6 to 6.5. The generation and deposition of fly ash during incinerator operations may have increased the pH of the soils in the vicinity around these sites. Based on the pH of surrounding soils, it is possible that the soils in the vicinity of both sites are naturally acidic. The difference between total C and organic C �contents at pH 7.5 indicates the presence of carbonates in these soils. Soil pH t

ends to naturally decrease rapidly after
ends to naturally decrease rapidly after carbonates are dissolved (van Breemen et al., 1983) owing to the buffering by carbonates such as CaCO 7. If so, then long-term decreases in soil pH, particularly at the MCOLF-Atlantic site where some surrounding soils are extremely acid, are likely to occur due to naturally- occurring soil acidification processes. Consequently, metal cation solubility and mobility could potentially increase and oxyanion (arsenate, selenate) mobility may decrease. The effects of pH on metal mobility are documented in Chapter 2 of this thesis. 24Table 1.2a. Selected chemical, physical, and mineralogical properties of nine soil samples collected from the MCALF-Bogue incinerator site (see Fig. 1.4 for sampling locations)Physical and chemical Properties MCALF Reference (0-25 cm) MCALF Reference (25-50 cm) MCALF Entrance (0-25 cm) AW MCALF Window (0-25 cm) AW2 MCALF Window2 (0-25 cm) A1A-38 MCALF Location 1A (38-70 cm) A1A-70 MCALF Location 1A (70-120 cm) 5.88 6.15 6.43 7.59 7.40 8.10 7.73 Soil color10 YR 2/1 (black) 10 YR 2/1 (black)

10 YR
10 YR 4/6 (dark-yellowish brown) 10 YR 4/3 (brown) 10 YR 4/3 (brown) 7.5 YR 4/6 (strong brown) 7.5 YR 4/6 (strong brown) Organic carbon (%) 0.61 0.02 1.40 0.04 0.29 0.06 0.51 0.00 0.72 0.00 0.11 0.00 0.09 0.01 Total carbon (%) 0.80 0.03 1.45 0.06 0.42 0.02 0.69 0.06 0.78 0.03 0.25 0.01 0.11 0.01 Oxalate (mg kgFe Al 690 9.8 488 35 0.2 516 34 2.4 566 46 13.6 1.8 572 33 11.9 2.2 580 63 0.1 438 27 0.3 CBD (mg kgFe Al 3,702 80 0.5 1,107 80 0.16 2,331 167 0.8 26 0.21 4,684 264 14.5 1.4 860 40 0.11 6,426 972 4 740 30 0.09 5,810 935 6 1200 90 5694 358 6.5 1060 35 4582 128 3 990 29 Replicates 3 3 3 3 3 3 3 Soil pH: 1:1 soil/water ratio on field-moist soil samples while stirring (Thomas, 1996). Soil color: Munsell Color on field-moist soil samples. Oxalate (Fe,

Mn) (Jackson, et al., 1986). CBD (Citr
Mn) (Jackson, et al., 1986). CBD (Citrate bicarbonate dithionite) (Fe, Mn) (Jackson, et al., 1986). /Fe : oxalate Fe / CBD Fe. ND: Not Detected. Standard deviations reported for measured values represent analytical errors. 25Table 1.2a (continued). Physical and chemical Properties A1A-120 MCALF Location 1A (120-150 cm) A2-0 MCALF Location 2 (0-25cm) 7.70 5.37 Soil color 10 YR 4/6 (dark-yellowish brown) 10 YR 4/6 (dark-yellowish brown) Organic carbon (%) 0.07 0.00 0.65 0.02 Total carbon (%) 0.07 0.01 0.66 0.02 Oxalate (mg kgFe Al 330 60 0.4 642 21 1 CBD (mg kgFe Al 4,446 535 1350 56 0.07 9869 576 0.8 1005 20 0.07 Replicates 3 3 26Table 1.2b. Selected chemical, physical, and mineralogical properties of six soil samples collected from the MCOLF-Atlantic incinerator site (see Fig. 1.4 for sampling locations)Physical and chemical Properties MCOLF Reference (0-25 cm) MCOLF Reference (25-50 cm) MCOLF Entrance (0-25 cm) OW MCOLF Wi

ndows (0-25 cm) O2-70 MCOLF Location 2 (
ndows (0-25 cm) O2-70 MCOLF Location 2 (70-100 cm) O4-0 MCOLF Location 4 (0-25 cm) 6.36 6.80 7.60 6.78 5.80 7.40 Soil color10 YR 2/1 (black) 10 YR 2/1 (black) 10 YR 3/1 (very dark gray) 10 YR 3/1 (very dark gray) 10 YR 2/1 (black) 10 YR 2/1 (black) Organic carbon (%) 3.23 0.11 0.68 0.01 1.07 0.01 0.53 0.03 0.20 0.03 3.04 0.02 Total carbon (%) 3.70 0.21 1.48 0.07 1.86 0.18 0.56 0.01 0.21 0.03 3.05 0.18 Oxalate (mg kgFe Al 1.5 460 74 4 640 74 7 0.13 0.3 19 CBD (mg kgFe Al 208 16 0.8 0.44 102 11 2608 447 116 0.18 2847 144 4 0.22 134 9.8 1.1 450 120 0.15 289 58 6 0.29 Replicates 3 3 3 3 3 3 Soil pH: 1:1 soil/water ratio on field-moist soil samples (Thomas, 1996). Soil color: Color determined by Munsell Color chart on field-moist soil samples. Oxalate (Fe, Mn) (Jackson, et al., 1986). CBD (Citrate bicarbonate dithionite) (Fe, Mn) (Jackson, et al., 1 /Fe: oxalate Fe / CBD Fe ND: Not Detected Standard deviations reported for measured values represent analytical errors. 27Soil Metal Concentrations Soil concentrations of heavy metals and metalloids in the 17 soil samples co

llected from around and inside incinerat
llected from around and inside incinerators at the MCALF-Bogue and MCOLF-Atlantic sites in October 2000 are reported in Tables 1.3a and 1.3b. The soil “Remediation Goal (RG)” reported by NCDENR (2000) for inactive hazardous waste sites were used as reference concentrations (listed in Tables 1.3a and 1.3b). Concentrations of the reference soil samples collected away from the incinerators are also shown. The LOQ values in Tables 1.3a and 1.3b indicate the lowest concentration of an element that we considered Concentrations of heavy metals and metalloids in soils taken from the vicinity of the incinerator at the MCALF-Bogue site ranged from 10 to 98 mg Zn kg, 4 to 46 mg , 3 to 55 mg Pb kg, 3 to 11 mg Cr kg, 0.01 to 0.9 mg Cd kg, 4 to 15 mg Ba , and 0.3 to 10 mg As kg. Silver was not detected in any of ten samples from the MCALF-Bogue site. Selenium was not detected in eight of ten samples. Concentrations of heavy metals (and metalloids) in soil samples taken from around the incinerator site at the MCOLF-Atlantic ranged from 6 to 101 mg Zn kg, 2 to 25 mg Cu kg, 29 to 105 mg , 1 to 9 mg Cr kg, Cd kg, Se kg, 3 to

81 mg Ba , and g As kg. Silver was not
81 mg Ba , and g As kg. Silver was not detected in any of four samples from the MCOLF-Atlantic site. The higher apparent concentrations of metals were found in soil samples from around the incinerator window and entrance at each site. The higher concentrations of Pb and Zn were measured in soils from near the incinerator entranceway at the MCOLF-Atlantic and from around incinerator window area at the 28Table 1.3a. Means and standard deviations of metal (metalloid) concentrations measured in nine soil samples recollected from the MCALF-Bogue incinerator site (see Figure 1.4 for sampling locations)Element Limit of Quantitation (LOQ) (mg kgSoil Remed- iation Goal (RG) (mg kgMCALF Incinerator (mg kgAR-0 MCALF (0-25 cm) (mg kgAR-25 MCALF (25-50 cm) (mg kgMCALF Entrance (0-25 cm) (mg kgMCALF Window (0-25 cm) (mg kgAW2 MCALF Window2 (0-25 cm) (mg kgArsenic 20 4.6 0.7 3.2 0.4 2.5 0.26 2.5 0.23 5.7 0.9 4.3 0.5 Barium 0.43 NV 1.2 7.3 0.3 8.2 0.6 7.4 0.3 12.7 0.7 15.4 0.5 Cadmium 0.386 0.02 0.88 0.05 0.76 0.02 0.6 0.5 0.87 0.05 0.2 0.5 Chromium 6.6 24,000 (46) 1 14 1 7.1 0.9 7 2 9 2 7.4 0

.9 Copper 0.8 2 1.9 2 1 4.2 0.3 14
.9 Copper 0.8 2 1.9 2 1 4.2 0.3 14 2.1 46 3 Iron 11 NV 3,700 500 3,700 600 3,500 200 4,900 400 7,000 1,000 5,500 300 Lead 1.3 14.1 1.1 11 1.5 3.4 0.9 25.3 3.7 55.2 4.7 Manganese 8.3 NV 1 73 1 24 1 31 4 41 5 22 6 Mercury* N/A N/A 0.3 5.6 0.6 N/A N/A N/A N/A Selenium2.3 78 Not detected 0.15 0.18 0.14 Not detected Not detected Not detected Silver 4.8 78 Not detected Not detected Not detected Not detected Not detected Not detected Zinc 1 13 1 15 2 9.7 1.5 41.4 3.7 98.3 9.2 Replicates 3 5 5 3 3 3 Solid Analytical Method (preparation and analysis) using US-EPA SW-846 3050/6010 for ICP-OES analysis. US-EPA SW-846 3050/7210 (Cu), 7380 (Fe), 7421 (Pb), 7460 (Mn) 7950 (Zn) for AAS.# Values reported in Table D-1 in “registered Environmental Consultant Program- Rules and Implementation Guidance”, June 2000; DENR-Div. of Waste Management (Superfund Section, Inactive Hazardous Sites Branch), 401 Oberlin Road, Raleigh, NC. NV = no value reported; Lower chromium value is for hexavalent chromium [Cr(VI)]. Limit of quantitation (LOQ) = 10 x the standard deviation of multiple measurement

s on a reagent blank. * Measured using n
s on a reagent blank. * Measured using neutron activation analysis (NAA) on whole-soil samples. N/A = Not applicable Standard deviations reported for measured values represent analytical errors. 29Table 1.3a (continued). Element A1A-38 MCALF Location 1A (38-70 cm) (mg kgA1A-70 MCALF Location 1A (70-120 cm) (mg kgA1A-120 MCALF Location 1A (120-150 cm) (mg kgA2-0 MCALF Location 2 (0-25 cm) (mg kgArsenic 0.2 3.3 0.2 0.3 0.6 10 0.9 Barium 2.1 6.8 0.2 3.9 0.6 6 Cadmium Not detected Not detected Not detected Not detected Chromium 0.4 3 1 8.1 0.3 11.0 0.2 Copper 1.3 4.7 0.3 3.9 0.2 3.9 0.2 Iron 5,800 200 4,400 400 4,400 1,000 9,900 3,000 Lead 2.6 6.8 0.3 8.4 1.0 16.1 8.8 Manganese 1 16.9 0.2 7 2 20 10 Mercury 0.2 N/A N/A N/A SeleniumNot detected Not detected Not detectedSilver Not detected Not detected Not detected Not detected Zinc 1.6 11.7 0.4 12.2 0.4 13.8 0.3 Replicates 3 3 3 3 30Table 1.3b. Means and standard deviations of metal (metalloid) concentrations measured in six soil samples recollected from the MCOLF-Atlantic incinerator site (see

Figure 1.4 for sampling locations).Elem
Figure 1.4 for sampling locations).Element Limit of Quantitation (LOQ) (mg kgSoil Remed- iation Goal (RG) (mg kgOIC MCOLF Incinerator (mg kgMCOLF (0-25 cm) (mg kgOR-25 MCOLF (25-50 cm) (mg kgOE MCOLF Entrance (0-25 cm) (mg kgOW MCOLF Windows (0-25 cm) (mg kgArsenic Not detected Not detected 0.3 0.7 0.2 Barium 0.43 NV 538.7 40 3.6 0.4 0.5 0.05 81.9 8 16.3 1.4 Cadmium 3.1 0.05 0.09 0.05 0.07 0.6 0.2 0.2 0.17 Chromium 6.6 24,000 (46) 0.4 1.6 0.1 0.33 0.06 8.6 0.5 4.4 0.14 Copper 9.7 4.9 0.3 2.0 0.2 19.1 0.1 3.2 0.8 Iron 11 NV 178,600 1100 280 30 120 40 2700 30 2800 20 Lead 10 6.3 10 16 2.5 104.7 18 31 5 Manganese 8.3 NV 6 11.5 0.9 10 3 1 1 4 MercuryN/A N/A 0.4 1.6 N/A Not detected N/A Selenium2.3 78 Not detected 0.3 0.16 0.18 0.4 0.1 0.2 0.1 Silver 0.4 Not detected Not detected Not detected Not detected Zinc 2 5.0 0.02 1.3 0.5 101.5 3 69.1 Replicates 3 2 4 5 5 Solid Analytical Method (preparation and analysis) using US-EPA SW-846 3050/6010 for ICP-OES analysis. US-EPA SW-846 3050/7210 (Cu), 7380 (Fe), 7421 (Pb), 7460 (Mn) 7950 (Zn) for AAS.# Values reported in

Table D-1 in “registered Environmental
Table D-1 in “registered Environmental Consultant Program- Rules and Implementation Guidance”, June 2000; DENR-Div. of Waste Management (Superfund Section, Inactive Hazardous Sites Branch), 401 Oberlin Road, Raleigh, NC. NV = no value reported; Lower chromium value is for hexavalent chromium [Cr(VI)]. Limit of quantitation (LOQ) = 10 x the standard deviation of multiple measurements on a reagent blank. * Measured using neutron activation analysis (NAA) on whole-soil samples. N/A = Not applicable Standard deviations reported for measured values represent analytical errors. 31Table 1.3b (continued). Element MCOLF Location 2 (70-100 cm) (mg kgMCOLF Location 4 (0-25 cm) (mg kgArsenic Not detected Not detected Barium 0.5 3 Cadmium 0.12 Chromium 0.03 2.6 0.8 Copper 1.4 24.6 1.4 Iron 80 300 Lead 3.6 67.0 3.2 Manganese 0.1 2.1 0.2 Mercury 0.1 N/A SeleniumNot detected Not detected Silver Not detected Not detected Zinc 0.3 6.2 1.7 Replicates 5 3 MCALF-Bogue site. The concentrations of heavy metals were mostly (with some exception) lower in reference soil samples colle�cted 500 feet from

each incinerator compared with in soil
each incinerator compared with in soil samples taken around incinerators (Table 1.3). Maximum concentrations of heavy metals in soil samples from the vicinity of incinerators at each site were mostly less than the Soil Remediation Goal (RG) for inactive hazardous waste sites in North Carolina (NCDENR, 2000) (Table 1.3). Only arsenic exceeded the RG of 4.6 mg kg in 2 of 10 samples. All 17 samples contained concentrations of As below our LOQ of 20 mg kg. As discussed in more detail below (see “Oxidation State of Chromium and Arsenic”), the form of arsenic in soil samples from the MCALF-Bogue site was predominantly As(V), which is less toxic and less mobile than As(III). Concentrations of heavy metals in samples taken from inside the incinerator at the MCALF-Bogue site are comparable to concentrations in samples from outside the incinerator at this site. At the MCOLF-Atlantic site, the greatest concentrations of all metals analyzed occurred in a sample of composite soil material collected from inside the incinerator. The sample was collected from material on top of a concrete and inlaid brick floor. Some re

sidual debris was present inside the inc
sidual debris was present inside the incinerator. The much greater level of Fe in this sample (178,600 mg Fe kg or 17.8 % w/w) suggested that finely-divided metallic debris might also have elevated the concentrations of other heavy metals. Oxidation State of Chromium and Arsenic Figure 1.5 shows Cr K-XANES spectra for physical mixtures containing different ratios of Cr(VI) and Cr(III). A sharp peak in the spectrum at an x-ray energy of 5994 eV is characteristic of Cr(VI). The pre-edge feature is due to 3d-4p electron orbital mixing 32 33 in the tetrahedrally coordinated Cr(VI)(Bajt et al., 1993). The integrated intensity (area) of the sharp pre-edge peak at 5994 eV increased linearly with increasing proportion of Cr(VI) in the sample (Figure 1.6). Since the area of the pre-edge peak is proportional to the amount of Cr(VI) in the sample, the proportions of Cr(VI) and Cr(III) in the soil samples should be quantifiable from the XANES spectrum. Figure 1.6 shows stacked, chromium K-XANES spectra for soil samples collected at various depths from sampling locations around the incinerator at the MCALF-Bogue

site. The absence of a pre-edge peak in
site. The absence of a pre-edge peak in the spectra for soil samples indicated that Cr(III) was dominant in these samples. A comparison with standards containing 0 or 10 mol% of total Cr as Cr(VI) (Figure 1.7) indicated that 0 mol% of the Cr in the soil samples was Cr(VI). Chromium(VI) is considered to be more toxic and generally more potentially mobile than Cr(III). Figure 1.8 shows arsenic K-XANES spectra for soil samples collected from around the incinerator at the MCALF-Bogue site, as compared with As(III) and As(V) standards. The shift in the K absorption edge of As(V) relative to As(III) is due to an increase in the binding energy of the K-shell (1s) electron with increasing oxidation state. Due to the greater binding energy of a 1s electron in As atoms of higher oxidation state, the As(III) standards has an absorption edge at 4 eV (relative energy), while that of the As(V) standard is at 8 eV (relative energy). A comparison of As K-XANES spectra for soil samples with standards of As(III) and As(V) indicated that As(V) was the dominant oxidation state in the soil samples. Synchrotron XANES spectra

indicated that soil samples from around
indicated that soil samples from around the incinerator sites contained predominantly As(V), the less toxic 34 y = 0.0505 + 2.0126x R2= 0.996Integrated area of pre-edge peak Proportion of Cr(VI) relative to total Cr (mol %) Figure 1.5 Stacked, normalized chromium K-XANES spectra for mixed Cr(VI)/Cr(III) standards diluted in boron nitride. The pre-edge peak at 5994 eV is absent in the Cr(III) standard [0 mol% Cr(VI)] and increases in intensity with increasing proportion of Cr(VI) in the mixture. Figure 1.6 Linear relationship between the integrated intensity of the Cr(VI) pre-edge peak in the K-XANES spectra and the proportion of Cr(VI) in physical mixtures of Cr(VI) (Kand Cr(III) (Cr) standards. 0.55980599060006010602060306040Normalized fluorescence yieldEnergy (eV)100 mol% 50 mol% 10 mol% 0 mol% 35 599060006010602060306040Normalized fluorescence yieldLocation 3 (50-76 cm) Location 3 (41-50 cm) Location 3 (0-20 cm) Location 2 (10-38 cm) Location 2 (0-10 cm) Location 1A (0-15 cm) 10 mol% Cr(VI) standard Cr(III) standard Energy (eV) Figure 1.7 Stacked, chromium K-XANES spectra for soil samples collect

ed at various depths from sampling locat
ed at various depths from sampling locations around the incinerator at MCALF Bogue Site 27. A comparison with standards containing 0 or 10 mol% of total Cr as Cr(VI) indicated that % of the Cr in the soil samples was Cr(VI). 36 Normalized fluorescence yield As K-edge = 11867eV As(III) standard As(V) standard Location 2 (41-50cm) Location 2 (50-76cm) Location 2 (0-10cm) Location 2 (10-38cm) Location 2 (38-58cm) Location 2 (58-84cm) Energy relative to the edge (eV) Figure 1.8 Arsenic K-XANES spectra for soil samples collected from sampling locations around the incinerator at MCALF Bogue Site 27as compared with As(III) and As(V) standards. Spectra for soil samples showed that As(V) was dominant. 37 and less potentially mobile forms of these elements when in soils. However, a shoulder at about 3 eV relative energy is apparent in the As K-XANES spectra for some soil samples. The shoulder possibly indicates the presence of minor amounts of As(III) in these samples. Soil Profile Geochemistry The samples taken from each site have been investigated to characterize the heavy-metal concentrations with depth in the

soils and evaluate the possibility that
soils and evaluate the possibility that metals at these sites are mobile. We present here the results of a geochemical investigation on samples collected in October 1999 (Hesterberg, 2001) with respect to vertical metal mobility. Figures 1.9 to 1.16 (soil properties related to heavy metal mobility data) represent the relationship between the chemical and mineralogical properties of soil samples and the distribution of Cu, Zn, Pb, As, and Cr concentrations in soil samples from different depths at four sampling locations at each incinerator site. These plots are intended to show whether any specific soil properties controlled metal mobility in the Concentrations of selected metals (Pb, Zn, Cu, Cr, and As) in each soil profile at the MCALF-Bogue site were mostly highest in the surface soil and typically decreased with depth. There are no apparent relationships shown between the distribution of heavy metals and the soil chemical and mineralogical properties. Soil profile observations indicated greater metal concentrations in the surface soil (30 cm) or approximately equivalent concentrations (considering error

bars) throughout each soil profile. Ac
bars) throughout each soil profile. Accumulation of oxide minerals of iron in soil profiles due to oxidizing redox conditions 38 at the MCALF-Bogue site, may limit the mobility and bioavailability of both metal and metalloids (see, e.g., Feand Pb, As, and Cr trends in Figures 1.7 and 1.8). The accumulations of Cu at the soil surface (cm) at this site appear to be partly dependent on higher organic carbon content in the uppermost layer (Figures 1.7 to 1.10). In surface materials, the total Cu concentration in soil solution is normally low owing to its high affinity for sorption by organic matter (Shorrocks and Alloway, 1987). Lead typically appears to accumulate in surface horizons of soils. Binding with organic matter may also contribute to strong retention of Cu and Pb in soil samples from the MCALF-Bogue site. The accumulations of metals at the surface represent the potential risk that the metal toxicity response (especially for Zn) in the vegetation at these sites could potentially be induced by acidification of the surface horizons. The distribution of Zn appears to be weakly related to the distribu

tions of Fe oxides or organic carbon. T
tions of Fe oxides or organic carbon. The variability of metal distributions in each profile may be due to soil movement during construction and operations of the incinerators. Depth profiles of heavy metal concentrations in sampling locations at the MCOLF Atlantic site showed that distribution of Pb, Zn, Cu, Cr, and As vary with depth (Figures 1.12 to 1.14). The accumulations of organic carbon and extractable aluminum occurred deeper (50-75 cm) in the horizons at sampling locations 3 and 4 (Figures 1.13 and 1.14). The depth accumulations of organic carbon content and aluminum are similar to the observations in typical Spodosols of North Carolina (Buol et al, 1997). The spodic horizon is defined by organic matter that has illuviated from horizons above. Leon and Murville soils mapped in the vicinity of the MCOLF-Atlantic site are Spodosols. The &#x 30 ;&#x-100;Spodosols of North Carolina is estimated to be 25,000 years old, judging by the amount 39 of organic matter translocated down-profile annually (Buol et al, 1997). Some accumulation of Zn and Pb appears at around 80 cm in the profile of location 2

(Figure 1.12), which may be the result o
(Figure 1.12), which may be the result of translocation from shallower horizons. Currently, no accumulation of organic C or extractable Al was apparent at this depth. In summary, no consistent relationships between metal concentrations and the measured soil properties were apparent in samples from the MCALF-Bogue and MCOLF Atlantic sites. Therefore, laboratory mobility experiments to more directly determine the effects of pH and redox potential on heavy metal mobility were conducted. 00.30.50.877.58Carbon (%)010200204060013.326.703.77.311ZnPb250500750Depth (cm)CBD-extractable Fe, Mn, and Al(mg kg(mg kg)(mg kg(mg kg(mg kgFig. 1.9 Relationship between soil chemical and mineralogical properties and the distribution of Cu, Zn, Pb, Cr, and As in soil samples at different depths from sampling location 1B (see Fig. 2) at the MCALF-Bogueincinerator site. (Data fromHesterberg, 2001). FeOrganicCarbonTotal CarbonMn scale: X 10Fe and Al scale: X 0.14101.73.354.75.877.51511223310203005101520050010001500Carbon (%)Depth (cm)CBD-extractable Fe, Mn, and Al(mg kg(mg kg(mg kg(mg kg(mg kgFig. 1.10 Relationsh

ip between the chemical and mineralogica
ip between the chemical and mineralogical properties and the distribution of Cu, Zn, Pb, Cr, and As concentrations in soil samples at different depths from samplinglocation 2 from Fig. 1 at the MCALF-Bogueincinerator site. (Data fromHesterberg, 2001). FeOrganicCarbonTotal CarbonMn scale: X 10Fe and Al scale: X 0.1Depth (cm)567817.552.50500100002460102002040012.525Carbon (%)CBD-extractable Fe, Mn, and Al(mg kg(mg kg(mg kg(mg kg(mg kgFig. 1.11 Relationship between the chemical and mineralogical properties and the distribution of Cu, Zn, Pb, Cr, and As concentrations in soil samples at different depths from samplinglocation 3 from Fig. 1 at the MCALF-Bogueincinerator site. (Data fromHesterberg, 2001). Fe00.30.5OrganicCarbonTotal CarbonMn scale: X 10Fe and Al scale: X 0.167802004006000480510150102030048Fig. 1.12 Relationship between the chemical and mineralogical properties and the distribution of Cu, Zn, Pb, Cr, and As concentrations in soil samples at different depths from samplinglocation 4 from Fig. 1 at the MCALF-Bogueincinerator site. (Data fromHesterberg, 2001). Carbon (%)Depth (cm)CBD-

extractable Fe, Mn, and Al(mg kg(mg kg(m
extractable Fe, Mn, and Al(mg kg(mg kg(mg kg(mg kg(mg kg00.30.50.8OrganicCarbonTotal CarbonMn scale: X 10Fe and Al scale: X 0.1Depth (cm)67827.582.51100408004825500306090510Carbon (%)CBD-extractable Fe, Mn, and Al(mg kg(mg kg(mg kg(mg kg(mg kgFig. 1.13 Relationship between the chemical and mineralogical properties and the distribution of Cu, Zn, Pb, Cr, and As concentrations in soil samples at different depths from samplinglocation 1 from Fig. 1 at the MCOLF-Atlantic incinerator site. (Data fromHesterberg, 2001). Fe00.71.32OrganicCarbonTotal Carbon567822.567.505010015024612.52520406080510Carbon (%)Depth (cm)CBD-extractable Fe, Mn, and Al(mg kg(mg kg(mg kg(mg kg(mg kgFig. 1.14 Relationship between the chemical and mineralogical properties and the distribution of Cu, Zn, Pb, Cr, and As concentrations in soil samples at different depths from samplinglocation 2 from Fig. 1 at the MCOLF-Atlantic incinerator site. (Data fromHesterberg, 2001). Fe0123OrganicCarbonTotal Carbon567801020123010202040612Carbon (%)Depth (cm)CBD-extractable Fe, Mn, and Al(mg kg(mg kg(mg kg(mg kg(mg kgFig. 1.15 Rel

ationship between the chemical and miner
ationship between the chemical and mineralogical properties and the distribution of Cu, Zn, Pb, Cr, and As concentrations in soil samples at different depths from samplinglocation 3 from Fig. 1 at the MCOLF-Atlantic incinerator site. (Data fromHesterberg, 2001). Fe01.32.74OrganicCarbonTotal Carbon46817.552.5050100150200012301020051015051015Carbon (%)Depth (cm)CBD-extractable Fe, Mn, and Al(mg kg(mg kg(mg kg(mg kg(mg kgFig. 1.16 Relationship between the chemical and mineralogical properties and the distribution of Cu, Zn, Pb, Cr, and As concentrations in soil samples at different depths from samplinglocation 4 from Fig. 1 at the MCOLF-Atlantic incinerator site. (Data fromHesterberg, 2001). Fe01.73.35OrganicCarbonTotal Carbon 48 CONCLUSIONS Heavy metal concentrations in 17 samples collected from around incinerators at the MCALF-Bogue and MCOLF-Atlantic sites ranged from 1 to 101 mg Zn kgmg Cu kg, 3 to 105 mg Pb kg, 0.3 to 12 mg Cr kg, g Cd kg0.6 mg Se kg, 0.5 to 81 mg Ba kg, and 0 mg As kg. Silver was not detected in any of 17 samples from each site. Maximum concentrations of heavy metals in so

ils were less than the Soil Remediation
ils were less than the Soil Remediation Goal for inactive hazardous waste sites in North Carolina (NCDENR, 2000). Synchrotron X-ray absorption near edge structure (XANES) analysis showed that less toxic and less mobile Cr(III) and As(V) were dominant forms of these elements in selected soil samples taken from the vicinity of incinerator at the MCALF-Bogue site. No strong relationships between the profile distributions of measured soil properties and metal concentrations were apparent. Overall, our data indicated no major concern for metal mobility at these sites presently, mainly because of the low soil metal concentrations, e.g., relative to soil remediation goals outlined by NC- 49 REFERENCE Aastrup, M., Johnson, J., Bringmark, E., Bringmark, L. Iverfeldt, A. 1991: Occurrence and transport of mercury within a small catchment area. Water, Air and Soil Pollution Alloway, B.J. 1995. Soil processes and the behavior of heavy metals. Heavy Metals in ed. Blackie Academic and Professional, Glasglow, UK. p. 11-37. Bajt, S., Clark, S.B., Sutton, S. R., Rivers, M. L., and Smith, J. V. 1993. Synchrotron X-ray micropro

be determination of chromate content usi
be determination of chromate content using X-ray absorption near-edge spectroscopy. Anal. Chem. 65. 1800-1804. Bodek, I., Lyman, W.J., Reehl, W.F., and Rosenblatt, D.H. 1988. Environmental Inorganic Chemistry: Properties, Processes and Estimation Methods, Pergamon Press, Buol, S. W., F. D. Hole, R. J. McCracken, and R. J. Southard. 1997. Soil genesis and classification. 3rd Edition. Iowa State University Press. Brown, GE, Foster AL, Ostergren JD. 1999. Mineral surfaces and bioavailability of heavy metals: A molecular-scale perspective. Proceedings of the national academy of sciences of the United States of America. 96: (7) 3388-3395 Mar 30. Dunnivant, F.M., Jardine, P.M., Taylor, D.L., McCarthy, J.F. 1992. Cotransport of cadimium and hexachlorobiiphenyl by dissolved organic carbon through columns containing aquifer material. Environ. Sci. Technol. 26:360-368. Dzombak, D.A. and Morel F.M.M. 1987. “Adsorption of Inorganic Pollutants in Aquatic Systems,” J. Hydraulic Eng., 113:430-475. Ellis, W.D. and Fogg, T. 1985. Interim Report: Treatment of Soils Contaminated by Heavy Metals, Hazardous Waste Engineering Resea

rch Laboratory, Office of Research and D
rch Laboratory, Office of Research and Development, U.S. EPA, Cincinnati, Ohio. Evanko, C.R. and Dzombak, D.A. 1997. Remediation of metals-contaminated soils and groundwater: Groundwater Remediation Technologies Analysis Center Technology Evaluation Report TE-97-01 (http://www.gwrtac.org/pdf/metals.pdf). Fendorf, S.E. 1999. Fundamental aspect and applications of x-ray absorption spectroscopy in clay and soil science. D.G. Schulze, J. W. Stucki, and P. M. Bertsch (Ed.) Synchrotron X-ray methods in clay science. Vol. 9, CMS Workshop Lecture Series, Clay Mineral Society, Aurora, CO. p. 20-67. 50 Fendorf, S.E. and D.L. Sparks. 1996. X-ray absorption fine structure spectroscopy. D.L. Sparks (Ed.) Methods of soil analysis, Part 3. Chemical methods, ASA-SSSA, Madison, WI. p. 377-416. Gambell, R.P. 1994. Trace and toxic metals in wetlands- a review. J.Environ.Qual. Helmke, P.A. 1996. Neutron activation analysis. D.L. Sparks (Ed.) Methods of soil analysis, Part 3. Chemical methods, ASA-SSSA, Madison, WI. p. 141-160. Hesterberg, D., D. E. Sayers, Zhou, G. M. Plummer, and W. P. Robarge. 1997. X-ray absorption spectrosco

py of lead and zinc speciation in a cont
py of lead and zinc speciation in a contaminated gdoundwater aquifer. Environ. Sci. and Technol. 31:2840-2846. Hesterberg, D. 2001. Soild-phase speciation and stability of soil heavy metal contaminants at the MCALF-Bogue and MCOLF-Atlantic incinerator sites. I. Metal concentrations, oxidation state of chromium and arsenic, and soil characteristics. First Report to the Marine Corps Air Station (MCAS), Cherry Point. Jackson, M.L., C.H. Lim, and L.W. Zelany. 1986. Oxides, hydroxides, and alumino silicates, In A.Klue (ed.) Methods of soil analysis. Part I. 2 ed. Agron. Monogr. 9 ASA and SSSA, Madison, WI.. p. 101-150. Kinniburgh, D.G., Jackson, M.L., and Syers, J.K. (1976), “Adsorption of Alkaline Earth,Transition, and Heavy Metal Cations by Hydrous Oxide Gels of Iron and Soil Sci. Soc. Am. J.Lee, J.F., S. Bajt, S. B. Clark, G. M. Lamble, C. A. Langton, and L. Oji. 1995. Chromium speciation in hazardous, cement-based waste forms. Physica B 208 & 209:577-578. McBride, M.B. 1994. Environmental Chemistry of Soils. Oxford University Press, New McGeehan, S. L., Naylor, D. V.1994. "Sorption and Redox Transfomation of Ar

senite and Arsenate in Two Flooded Soils
senite and Arsenate in Two Flooded Soils", Soil Sci. Soc. Am. J., 58, 337-342. McKeague, J. A., and J. H. Day. 1966. Dithionite and oxalate extractable Fe and Al as aids in differenting various classes of soil. J. Soil Sci. 46: 13-22. NCDENR (North Carolina Department of Environment and Natural Resources). 2000. Registered Environmental Consultant Program – Rules and Implementation Guidance (June 2000), Div. of Waste Management (Superfund Section, Inactive Hazardous Sites Branch), 401 Oberlin Road, Raleigh, NC. NRC. 1994. Alternatives for Ground Water Cleanup, National Research Council, National Academy Press, Washington, D.C. 51 Sayers D.E. and Bunker B.A. 1988. Data analysis. In D.C. Koningsberger and R Prins (Ed.) X-ray absorption: Principles, applications, techniques of EXAFS, SEXAFS, and XANES, John Wiley and Sons, New York. p. 211-253. Schaller, T., Moor, H.C., Wehrli, B. 1997. Sedimentary profiles of Fe, Mn, V, Cr, As and Mo as indicators of benthic redox conditions in Baldeggersee. Aquat. Sci. 59, 345-Schulze, D.G., S. R. Sutton, and S.Bajt. 1995. Determining manganese oxidation state in soils using x

-ray absorption near-edge structure (XAN
-ray absorption near-edge structure (XANES) spectroscopy. Soil Sci. Soc. Am. J. 59:1540-1548. Schwertmann, U. 1993. Relations between iron oxides, soil color, and soil formation. P. 51-69. In J. M. Bigham and E. J. Ciolkosz (Ed.) Soil Color. SSSA Special Publ. No. 31, Soil Sci. Soc. Am., Madison, WI. Shorrocks, V. M. & Alloway, B. J.1985. Copper in plant, animal and human nutrition. Copper Develop. Assoc., Report TN 35, Orchard House, Potters Bar, Herts., U.K. Sposito, G. 1989. The Chemistry of Soils. Oxford University Press. p107 Szulczewski, M. D., P.A. Helmke, and W. F. Bleam. 1997. Comparison of XANES analyses and extractions to determine chromium speciation in contaminated soils. Environ. Sci. Technol. 31:2954-2959. Thomas, G.W. 1996. Soil pH and soil acidity. In, D.L.Sparks (ed.) Methods of soil analysis, Part 3. Chemical methods, ASA-SSSA, Madison, WI. p 475-490. Taylor R.M., Schwertmann U. 1974. Maghemite in soils and its origin (I) Properties and observation on soil maghemite. Clay Miner. 10:289 -297. US-EPA. 1996. Report: Recent developments for in situ treatment of metals contaminated soils, U.S. Env

ironmental Protection Agency, Office of
ironmental Protection Agency, Office of Solid Waste and Emergency Response. Van Breemen, N., Mulder, J. and Driscoll, C. T. 1983. Acidification and alkalinization of soils. Plant Soil 5: 283–308. Wagner, R.E. 1996. Guide to Environmental analytical methods, 3 edition. Genium Publishing, New York. pp. 65-74;116 Walkley, A., and Black, I.A. 1934. An examination of the method for determining soil organic matter and a proposed modification of the chromic acid titration method. Soil 52 Wang, Z., Hesterberg, D., D. E. Sayers, W. Zhou, and W. P. Robarge. 1998. Extended X-ray absorption fine study of mercury speciation in a flood plain soil. : Contaminated soils: Third International Conference on the Biogeochemistry of Trace Elements, Paris, May 15-19, 1995 (ed. Prost, R.), D:\data\communic\009.PDF, colloque 85, INRA Editions, Paris, France. Zimdahl, R. L. and Skogerboe, R. K. 1977. Behavior of lead in soil. Environ. Sci. CHAPTER TWO: COLUMN FLOW STUDY INTRODUCTION To select an appropriate in situ soil remediation strategy, it is necessary to evaluate the potential long-term changes in heavy metal solubility in soi

ls This Chapter reports research result
ls This Chapter reports research results of studies to determine potential changes in heavy metal solubility at the two field sites described in Chapter 1. Forstner (1991) and Calmano et al. (1993) note that pH and redox conditions can influence most of the processes regulating the speciation of metals in soils in the following ways: - adsorption/desorption onto the different solid components; - adsorption/ coprecipitation onto hydrous oxides of Fe and Mn; - formation/decomposition of soluble and insoluble metal organic complexes; - dissolution of carbonates, metal oxides or hydroxides; - precipitation as insoluble sulfides under strongly reducing conditions and dissolution as sulfates under oxic conditions. Heavy metal cation solubility typically increases with decreasing pH (McBride, 1989). Solubility of heavy metals is strongly pH-dependent because sorption increases with increasing pH. That is, the lower the pH, the more metal can be found in solution and thus, the metal is potentially more mobile. The solubility of oxyanions (e.g. arsenate and selenite) typically decreases with decreasing pH. These re

actions are mainly associated with pH-de
actions are mainly associated with pH-dependent surface charge and chemisorption mechanisms caused by protonation or deprotonation of the surface hydroxyls of oxide minerals (Hesterberg, 1998). In addition to adsorption/desorption reactions, pH influences heavy metal solubility either through precipitation/ dissolution reactions or complexation by soluble and surface-bound ligands. The influence of pH can be stronger than Eh on the solubility of heavy metals, especially Cd, Cu, Zn, and Pb (Chuan et al., 1996). Reducing conditions induce direct and indirect effects on metal speciation and mobility through changing pH and soil constituent properties. Heavy metals can be grouped with respect to these influences. Some elements change oxidation states in response to redox potential in soils, for example, As, Mo, Se, V, Cr and Hg. The influence of redox conditions on their speciation is direct. Other metals have only one stable oxidation state in soils, but a change in redox conditions can indirectly influence their speciation and mobility: formation of insoluble sulfides, release from sorption sites by reduct

ive dissolution of Fe and Mn oxides, or
ive dissolution of Fe and Mn oxides, or increased fixation by these minerals after alteration (McBride, 1994). For example, some heavy metal cations (e.g. Cu, Pb, Zn, Hg) appear to be less soluble under reduced soil conditions than under oxidized conditions (Gambrell, 1994), particularly when present as metal sulfide species (Calmano et al., 1994). When reducing conditions cause the dissolution of hydrous Mn, Al and Fe oxides, their co-precipitated metals are released into the soil solution (Sposito, 1983). In general, Fe and Mn oxides, and organic matter are affected by reducing conditions and affect the behavior of other metals, until the redox potential is low enough to form metal sulfide precipitates. Higher solubility of Cd, Zn, and Pb were observed when soil Eh was lower (Chuan et al., 1996), only if soil Eh is not low enough to form sulfides. The reductive dissolution of Fe and Mn are apparently associated with this effect. Francis and Dodge (1990) reported that Cd, Cr, Ni, Pb, and Zn coprecipitated with synthetic goethite could be solubilized under anoxic conditions by microbial activity. Reducing

conditions in soils require water satura
conditions in soils require water saturation combined with the presence of degradable organic compounds to support microbial activity in the absence of oxygen (McBride, 1994). After dissolved oxygen is consumed by microbial activity, microbial activity changes from aerobic to anaerobic. Instead of oxygen, anaerobic respiration by organisms begin to use oxidized chemical species such as NO (aq), Mn (IV), Fe(III), (aq), and finally CO as electron acceptors. For example, in saturated soils, oxygen is quickly depleted and microbes must utilize the next most favorable electron acceptor. Under these conditions, Mn and Fe-oxides can be reduced to Mnfavorable electron acceptors are depleted, sulfate, SO is reduced to sulfide. Chalcophilic heavy metals such as Hg, Cu, Pb, and Zn may precipitate as sulfides. Chromium oxidation has received much attention, because the toxicity of chromium in aquatic and terrestrial environments depends on its oxidation state. Chromium(VI) is a more mobile and potentially toxic form than Cr(III). In Chapter 1, synchrotron XANES spectra showed a dominance of Cr(III), the less mobile

and less toxic form, in selected field-m
and less toxic form, in selected field-moist soil samples. However, Cr(III) could be an environmental concern if Cr(III) is converted to Cr(VI). The oxidation of Cr to Crcan be induced by the reduction of Mn in manganese oxide minerals (Manceau and Charlet, 1992). The mechanism is adsorption of the Cr(III) cation on Mn oxide surfaces followed by electron transfer to Mn via an oxygen bridge. The Cr(VI) forms an anion that is released from the surface. For example, under alkaline to slightly acidic conditions Cr(VI) compounds, i.e. CrO, and Cr, are not strongly absorbed by many soil surfaces and remain in soil solution. When evaluating the biological and ecological impacts of soil contamination, it is necessary to estimate the amount of heavy metals present and their potential to be solublizied over longer time periods. The potential for metal transport over long-term periods is difficult to evaluate due to the conflicting influence of various soil parameters and the difficulty of detecting metal speciation in the soil matrix. Numerous studies have been conducted concerning the transport of potentially to

xic heavy metals in soils (Sheppard et a
xic heavy metals in soils (Sheppard et al., 1991, Alesii et al., 1980, Camobreco et al., 1996). Many studies have used model systems to determine which soil parameters control metal solubility and Short term column and soil incubation studies were conducted in an attempt to simulate how long-term changes in pH and redox potential may influence metal solubility and transport at one or both incinerator sites. The laboratory-scale column experiments were conducted to directly assess impact of pH on heavy metal solubility. Soils tend to acidify over time, depending on rates of acid inputs and soil pH buffering capacity (van Breemen et al., 1983). In general, acidification of topsoil (0-30 cm) from circumneutral pH to pH 4 took about 100 years in soil at Rothmsted Experimental station in England (Johnston et al., 1980). The influence of changes in redox potential on metal solubility was also evaluated for soils from the MCALF-Bogue site, since this site could be subject to flooding for prolonged periods of time. The objective of this research was to determine the range of soil pH and Eh conditions that minimize t

he dissolution and potential toxicity of
he dissolution and potential toxicity of any heavy-metal contaminants in soils surrounding abandoned incinerators at two outlying US Marine Corps air fields: MCALF-Bogue and MCOLF-Atlantic. MATERIALS AND METHOD Column Setup Column Flow System Column flow experiments were performed on seven columns of soil samples (AE, AW, AW2, A1A-38, A1A-70, A1A-120, and A2-0) from the MCALF-Bogue incinerator site and four columns of soil samples (OE, OW, O2-70, and O4-0) from the MCOLF-Atlantic incinerator site. The column flow study was designed to determine the concentrations of metals dissolved from soil samples from the incinerator sites as a function of pH. This system consisted of a flask of 0.01 M CaCl solution purged with either N2(g) or compressed air, a peristaltic pump, a soil column, 60 ml Teflon bottles to collect effluent samples, a potentiometer for pH and Eh measurement, and a PC controller to continuously collect pH and Eh data (Figure 2.1). In-line micro-sized pH NMulti channel pertistaltic pump 60 ml Teflon Bottle pH, Redox, and Reference electrodes Fluid Reservoir (0.01 M CaClPotentiometer Tef

lon tube (0.16 cm ID) Tygon tube (0.16
lon tube (0.16 cm ID) Tygon tube (0.16 cm ID) or Figure 2.1. Schematic diagram of the overall column flow system used to study soil metal mobility as affected by pH. and Eh (redox) electrodes were connected into a Teflon flow line between the soil column and effluent sample bottle.The columns were made of 3.8 cm long sections of Teflon (FEP) pipe (3.2 cm ID) fitted with 2.5 cm long chromatography column end plugs with 20 m Teflon bed support screens (Figure 2.2). Figure 2.2. Schematic diagram showing details of a soil column for the flow experiments Approximately 13.7 g of the moist soil was used, yielding a porosity of 0.36 (1PV= ), and a bulk density of 1.7 g cm in a 1 cm long column (assuming particle density of 2.65 g cm). The soil was mixed well with deoxygenated, deionized water to make a slurry in a Teflon beaker. The suspension was poured very rapidly and quantitatively (no sample loss) into a Teflon sleeve set in the bottom end plug while chromatography column end fittings with 20 m Teflon bed support screens Teflon sleeve 3.2 cm ID x 1 cm long soil column Effluent simultaneously drawin

g a vacuum to remove free water. The san
g a vacuum to remove free water. The sandy soil settled uniformly in 2-3 seconds and the excess water was quickly removed by the vacuum pump (Figure 2.3). The columns for more reduced soil samples from the MCOLF-Atlantic incinerator site were packed in a glove box under an N2(g) atmosphere and a safe light. Figure 2.3 Schematic diagram illustrating the steps to preparing a soil column for column flow experiments Effect of pH Deoxygenated (N purged) and/or oxygenated (aerated with normal air) electrolyte solutions was flowed through each column at a rate of 0.1 mL per minute during an slurry Vacuum Pump Add deionized water to make a slurry Sample BottleSoil Sample STEP 1 STEP 2 Final Column approximately 300 h flow period. After an initial 24 h application of deoxygenated 0.01 M CaCl solutions, aerated 0.01M CaCl solutions were applied to the more oxidized soil samples from MCALF-Bogue, and deoxygenated 0.01M CaCl solutions were pumped through the soil samples from MCOLF-Atlantic (Figure 2.4). Figure 2.4. Typical sequence of electrolyte solutions flowed through each column in the

experiments to evaluate pH effects on me
experiments to evaluate pH effects on metal dissolution. To determine how metal solubility was affected by pH, 0.01 M CaClcontaining 0.00005 to 0.002 M HCl were flowed through the columns to decrease pH at a fairly constant rate from the initial effluent pH to about pH 4 during approximately 280 h of flow. Effluent samples collected every ten to eleven hours were acidified with 1 M HCl to pH 2 to 2.5 and stored in 60 mL Teflon bottles at 4C until analyzed. Dissolved As, Ba, Cd, Se, and Ag in the effluent samples were measured using inductively coupled plasma-optical emission (ICP-OES) spectrometry (Perkin Elmer Emission Spectrometer Model 2000 DV). Concentrations of Cu, Zn, Pb, Cr, Fe, and Mn in the effluent samples were determined using flame atomic absorption spectrometry (FAAS) (Perkin Elmer (50-65 PV) Aerated or deoxygenated, acidified (Average column 1PV = 3.0 0.00005 to 0.002 M HCl Model 3100). Under optimal operating conditions, the analytical detection limits using AAS are 0.001 mg Cu L, 0.010 mg Pb L, and 0.001 mg Zn L. Average detection limits calculated on the basis of tripling the standard devi

ation of the absorbance reading for the
ation of the absorbance reading for the blank standard (0 mg L standard) (Klestra and Bartz, 1996) in our study were 0.008 mg Cu L, 0.017 mg Pb L, and 0.009 mg Zn LpH effects on chromium oxidation state Synchrotron XANES spectra were used to evaluate the effects of pH on Cr oxidation state in a column flow study, and to determine the heterogeneity of soil sample with respect to Cr oxidation states. Cr K-XANES analyses were done at Beamline X-11A at the National Synchrotron Light Source (NSLS), Brookhaven National Laboratory (BNL), Upton NY. The detailed procedures were described in Chapter 1. Two types of soil samples were analyzed using XANES: (i) a subsample of selected original moist soil samples from sample location AW2 (containing higher levels of Cr) at MCALF-Bogue site, and (ii) corresponding soil subsamples that were subjected to various degree of acidification in column flow studies. Because we observed evidence for Cr(VI) in two soil subsamples from the first set of column experiments (Figure 2.5), we performed two additional experiments on subsamples from sampling site AW2 (MCALF-Bogue). These experi

ments were designed to ensure that subsa
ments were designed to ensure that subsample heterogeneity did not affect our measurements of Cr oxidation state, and assess whether incremental changes in soil pH affected Cr oxidation states. Four subsamples of soil from sample AW2 were analyzed to determine heterogeneity of this soil sample with respect to Cr oxidation states. Since soil samples were mixed and divided into three different amber bottles after collection from the incinerator sites, moist subsamples from each bottle (Figure 2.5) were mounted in acrylic sample holders for XANES analysis. Six different treatments were performed to determine oxidation state changes influenced by pH and time on six soil columns. Acidified CaCl solution was used for 72 to 216 hours to decrease effluent pH from pH 7.4 to about pH 4.0. The detailed soil packing methods used were described in Chapter 1. In order to perform column experiments on more homogeneous samples enough sample from Bottle 3 (Figure 2.5) for six soil columns was suspended in 0.01M CaCl solution (Figure 2.6). While stirring AW2 Bottle 2 AW2 Bottle 3 WINDOW ENTRANCE Sampling location-MCALF

Bogue LOCATION 1AA1A-15 A1A-28 AIA-48LO
Bogue LOCATION 1AA1A-15 A1A-28 AIA-48LOCATION 2 A2-0AW2 Bottle 1 XANES, May 2001 XANES, Aug. 2001 No evidence for Cr (VI) 0 % Cr (VI) Figure 2.5 Schematic diagram of soil subsamples for Cr K-XANES analysis to determine sample heterogeneity. this suspension, six 5 mL aliquots were transferred to beakers using a pipette, then each aliquot was packed into columns as described above (Figure 2.6). To minimize inducing Cr(III) oxidation and Cr(VI) reduction, all soil columns were wrapped in aluminum foil to eliminate light and prevent evaporation. Vacuum Pump Stirring magnetic stirrer end-cut from pipette tip 5 mL auto-pipette Figure 2.6 Schematic diagram for subsampling and column packing for the Cr(III) oxidation experiment Effects of reducing conditions on mobility of heavy metals We designed this incubation study to measure the dissolution of chromium (Cr), lead (Pb), copper (Cu), zinc (Zn), iron (Fe), and manganese (Mn) during microbial reduction of seven soil samples from the MCALF-Bogue incinerator site as a function of redox potential. Because soils at the MCALF-Bogue site are well-drained,

microbially reduction of samples of the
microbially reduction of samples of these soils may dissolve heavy metals associated with Fe-oxides. The important process is adsorption-desorption of metals on Fe and Mn oxides (Forstner, 1991), which are affected by reducing conditions. From known moisture contents, 3.00 g (dry weight basis) of moist soil samples were precisely weighed into 40 mL Tefloncentrifuge tubes with Teflon-tape sealed threads. Twelve replicates for each soil sample were prepared to yield triplicate subsamples for each of four time treatments (Figure 2.7). To induce microbial reduction C1 C2 C3 A1 A2 A3 Triplicate y B1 B2 Triplicate yTriplicate ys D1 D2 D3 Triplicate ys inal soil sample in amberbottle Figure 2.7 Schematic diagram for the microbial reduction experiment with different of soil samples, 30 mL of 0.01M CaCl solutions with 0.2% dextrose (equivalent to 0.8 mg C g soil) were added to each Teflon centrifuge tube. For the first 5 days of incubation, tubes were capped with LDPE balloons to prevent pressure build up. Thereafter, the tubes were tightly capped. The Teflon centrifuge tubes were wrapped in aluminum foi

l to reduce gas permeability and elimina
l to reduce gas permeability and eliminate light. These samples were placed in a constant-temperature water bath shaker, pre-equilibrated at 25 C. Samples were incubated with shaking at 25 C in darkness during 0, 10, 20, and 30 days. After 0, 10, 20, or 30 days of incubation, triplicate samples of each soil were removed and the oxidation-reduction potential (ORP; Eh) was measured on suspensions in a glove box 2(g) atmosphere and a safe light. Before measurement of OPR, the Pt electrode was calibrated by measurements in pH buffer solutions (pH 4 and 7) saturated with quinhydrone. Then the OPR was calculated by adding 202 mV to measurements using a Calomel reference electrode to standardize Eh to a "Standard Hydrogen Electrode"(SHE). The samples were centrifuged at 15,000 rpm for 15 minutes and the supernatant solutions were decanted into 30 mL Teflon bottles. pH was measured on a subsample (1 mL) of supernatant solution. The rest of solution samples were acidified with 1 M HCl to pH 2 to C until they were analyzed. Concentrations of Cu, Zn, Mn, Fe, Cr, and Pb were determined by FAAS. RESULTS AND DISCUSSIONS Met

al dissolution in soil samples from MCAL
al dissolution in soil samples from MCALF-BogueFigures 2.8a and 2.8b contain example metal dissolution data for a column from the MCALF-Bogue site. Plots show the change in pH and concentrations of dissolved metals in column effluent samples as a function of volume of acidified, 0.01 M CaClthroughput. Redox potential was not controlled and Eh increased with decreasing soil pH (data not shown), as expected (Patrick et al., 1996; Lindsay, 1979). Figures 2.9a and 2.9b illustrate four column studies using subsamples from the same sampling location (AW2) showing trends of dissolved metal, particularly Cu and Zn, as a function of pH. These figures indicate that the trends in effluent results are reproducible in replicated column experiments. For the remaining soils tested other than AW2, only one column experiment was performed per soil. All results of dissolved Cu, Pb, and Zn concentrations as a function of pH on seven column experiments from the MCALF-Bogue site are shown in Appendix Figures A1, A3, A5. The important trend in the column flow results on samples from the MCALF-Bogue site was that decreasing pH to 4

.0 or less caused an increase in dissolv
.0 or less caused an increase in dissolved Cu, Zn, and Pb concentrations in the column effluent samples. The maxima concentrations observed were 1.3 mg Zn L, 0.317 mg Cu L, and 0.112 mg Pb L at the minimum pH. This result was consistent with the higher solubility of metal cations under acidic conditions (McBride, 1989). Except for Zn, dissolved metal concentrations were not detectable in the majority of effluent samples having pH � 4.0; i.e., concentrations were below the detection limits of 0.008 mg Cu Land 0.017 mg Pb L 68 Fig 2.8a. Dissolved concentrations of copper, chromium, lead, iron, manganese, and zinc in effluent solutions collected during a column flow experiment on a soil sample from window site (AW), MCALF-Bogue. (Detection limits determined in this study were 0.008 mg Cu L0.021 mg Cr L, 0.017 mg Pb L, 0.008 mg Mn L, 0.024 mg Fe L, and 0.009 mg Zn L 69 Fig 2.8b. Dissolved concentrations of arsenic, barium, cadmium, selenium, and silver in selected effluent solutions collected during a column flow experiment on a soil sample from window site (AW), MCALF-Bogue. (Detection limits dete

rmined in this study were 0.03 mg As L,
rmined in this study were 0.03 mg As L, 0.10 mg Ba L, 0.008 mg Cd L, 0.04 mg Se L, and 0.01 mg Ag L 70 0.10.20.30.40.50.634567Dissolved [Cu] (mg LFigure 2.9a Dissolved concentrations of copper in effluent solution for column flow experiments on four replicate samples from near the incinerator window (AW2) at MCALF-Bogue. (Detection limit of 0.008 mg Cu L). 0.51.534567Dissolved [Zn] (mg LFigure 2.9b Dissolved concentrations of zinc in effluent solutions for column flow experiments on four replicate samples from near the incinerator window (AW2) at MCALF-Bogue. (Detection limit determined in this study was 0.009 mg Zn LThe cumulative discharge of all three metals measured in effluent samples from each column during the entire flow experiment was less than 65 % of the mass in the soil columns based on the mass of sample used and metal concentrations measured by acid digestion (Chapter One). Figures 2.10, 2.11, and 2.12 show typical trends of dissolved Cu, Pb, and Zn as a function of pH measured in effluent samples of soil columns from the MCALF-Bogue site. These data showed a substantial release of dissolve

d metal into solution occurred below a c
d metal into solution occurred below a certain threshold pH. The threshold pH was determined at this point where 0.010.020.030.040.053456789Dissolved [Cu] (mg LLocation 1A (120-150 cm) threshold pH Figure 2.10. Dissolved Cu in column effluent solutions for soil samples taken near the incinerator window (AW) and location 1A (120-150 cm) at MCALF- Bogue, as affected by pH. (Detection limit of 0.008 mg Cu L). significant metal dissolution occurred (the pH below which dissolved metal concentrations were greater than 5 times the standard deviation of concentrations in �samples at pH 4.5 for �Cu and Pb, and at pH 5.5 for Zn). Dissolved Cu was below our FAAS detection limit in the majority of effluent samples collected when pH�4. The cumulative mass of Cu discharged from each column during the entire flow experiment was less than 50 % of the total Cu measured in soil subsamples (Chapter One). Like Cu, dissolved Pb concentrations in effluents of most samples from columns of soil samples from MCALF-Bogue remained below our FAAS detection limit of 0.018 mg Pb L0.040.080.120.16345678Diss

olved [Pb] (mg LFigure 2.11 Dissolved P
olved [Pb] (mg LFigure 2.11 Dissolved Pb in column effluent solutions for soil samples taken near incinerator window (AW2) and location 1A (38-70 cm) at MCALF- Bogue, as affected by pH. (Detection limit of 0.018 mg Pb LAW2Location 1A (38-70 cm) threshold pH threshold pH Effluent samples from only two of seven column experiments showed dissolved Pb increasing to a maximum of 0.112 mg Pb L as pH dropped below 4.0 (Figure 2.11). The total Pb dissolved during a column experiment was 6% of total Pb in each column soil sample. The pH-dependent concentration of Zn in column effluent varied from g Zn L at neutral pH to 1.25 mg Zn L at pH A mean constant to perhaps slightly increasing dissolved Zn concentration was noted between pH 6.5 and 5.0 during the acidification study (Figure 2.12). The dissolution of Zn over the wide pH range studied Fig 2.12 Dissolved Zn in effluent solutions for soil samples taken near incinerator window (AW2) and location 1A (38-70 cm) at MCALF- Bogue, as affected by pH. (Detection limit determined in this study was 0.009 mg Zn L0.20.40.60.81.21.4345678Dissolved [Zn] (mg LAW2

Location 1A (38-70 cm) threshold p
Location 1A (38-70 cm) threshold pH threshold pH 74 (pH 3.5 to 7.9) may be attributable to different Zn species in soils. Any increase of dissolved Zn at pH � 5 may be related to the dissolution of Zn-carbonates (e.g, hydrozincite) if present. During the experiment, up to 64 % of total Zn in the column soil was released into effluent solutions. The maximum concentrations of Cu, Pb, and Zn recorded were measured in column effluents from the sample from the vicinity of the incinerator window (AW2) at the MCALF-Bogue site (Figure 2.13). As discussed below, this result is consistent with higher concentrations of Cu, Pb, and Zn in the soil at sample location AW2. 0.20.40.60.81.21.434567Dissolved metal concentration (mg LFigure 2.13 Dissolved concentrations of copper, lead, zinc in effluent solutions for a column flow experiment on a sample from near the incinerator window (AW2) at the MCALF-Bogue. Dissolved Zn was greater over a wider pH range than Cu and Pb. This is consistent with are more strongly adsorbed by iron oxides or organic matter (Stevenson, 1976) than the Zn. Kinniburgh et el. (197

6) assessed the selectivity sequence for
6) assessed the selectivity sequence for the retention of heavy metal cations as (figures in parentheses indicate pH ± 0.2 for 50% re�tention): Pb(3.1) Cu(4.1) � Zn(5.4�) Cd(5.8) (also see Figure 1.2 in Chapter 1). Pickering (1988) also reported the intrinsic affinity of the heavy metals on goethite (FeOOH) decreases in the order Cu� Pb � Zn � Cd. This would agree with the observation that Zn was released to solution to a greater ex�tent at pH 5.3 than Cu and Pb in our study if all three metals were largely adsorbed to the soil Fe-oxide minerals. As discussed in chapter one, the lower ratios of oxalate- to CBD-extractable Fe and the soil colors at the MCALF-Bogue site suggested that goethite was the dominant Fe-oxide mineral present. Also complexes of Cu and Pb with soil organic matter may contribute to stronger retention of Cu and Pb than that of Zn in the surface soil samples. Cu(II) and Pb(II) can be more strongly complexed by organic matter (Stevenson, 1976) or iron oxides (Balikungeri & Haerdi, 1988) than Zn(II). In general, soil organic matter has a

n intrinsically stronger affinity for Cu
n intrinsically stronger affinity for Cu(II) and Cd(II) than oxide minerals, especially under acid conditions (McLaren et al., 1983; Zachara et al., 1992). Alcacio et al. (2001) showed that Cucan serve as a bridging cation between organic matter and goethite in a Type A ternary complex for low levels of adsorbed organic matter (humic acid). Table 2.1 summarizes the results of seven column flow experiments on soil samples from the MCALF-Bogue site, including the threshold pH, means of dissolved metal concentrations above pH 5.5, dissolved metal concentrations at pH 4.0, and maximum concentrations of dissolved metal recorded. The range of threshold pH (Table 2.1a) for increasing dissolved Cu in all seven soil column flow experiments on samples from the MCALF-Bogue site was 3.9 to 4.4 (mean threshold pH = 4.1 ± 0.2). Significant increases in dissolved Pb occurred in two of seven column studies at pH 4.1. The threshold pH where an increase in dissolved Zn was observed for the seven flow experiments on samples ranged from 4.2 to 5.3 (mean threshold pH = 4.6 ± 0.4). The maximum concentrations measured were 0.317 mg

Cu L, 0.112 mg Pb L, and 1.3 mg Zn L at
Cu L, 0.112 mg Pb L, and 1.3 mg Zn L at pH cept for Zn, dissolve metal concentrations were not detectable in the majority of effluent samples having pH. ;x-1;�.80; 5.5; i.e., concentrations were below the detection limits of 0.008 mg Cu L-1 and 0.017 mg Pb LThe maximum Cu concentration of 0.317 mg Cu L-1 in the column effluent is approximately 30 % of the groundwater quality standard of 1.0 mg Cu L adopted in North Carolina for Class GA groundwaters (NC-DEHNR, 1993). The maximum concentration of dissolved Pb measured in these column effluents (0.112 mg L) was above the groundwater standard of 0.015 mg Pb L adopted in North Carolina (NC-DEHNR, 1993). However, a lack of sensitivity of flame AAS for Pb (detection limit of 0.017 mg L) did not allow accurate evaluation of the concentrations of dissolved Pb in most effluent samples relative to the ground water standard of 0.015 mg L. The highest dissolved Zn concentration measured in column effluent was 1.25 mg Zn L-1 (at pH 4.0), which was about 60the groundwater standard (2.1 mg Zn L adopted in North Carolina (NC-DEHNR, Based on Zn dissolution dat

a (mean threshold pH =4.6 0.4), we reco
a (mean threshold pH =4.6 0.4), we recommend that soil pH be maintained at . ;x-1;�.80;pH5 to prevent increased dissolution of metals. Table 2.1. Summary of dissolved concentrations of selected metals in effluent samples of column flow experiments on soil samplfrom the MCALF-Bogue site. Copper Lead Zinc Column Samples Threshold Dissolved Cu � pH 5.5 (mg LDissolved Cu at pH 4.0 (mg LMaximum dissolved Cu (mg LThreshold Dissolved Pb �pH 5.5 (mg LDissolved Pb at pH4.0(mg LMaximum dissolved Pb (mg LThreshold Dissolved Zn �pH 5.5 (mg LDissolved Zn at pH4.0(mg LMaximum dissolved Zn (mg LAE 4.0 Not (± 0.004) (pH 3.8) Not shown Not Not Not (± 0.004) (± 0.008) (pH 3.8) AW 4.1 Not (± 0.008) (pH 4.0) Not shown Not (± 0.006) (pH 4.0) (± 0.011) (± 0.012) (pH 3.8) AW2 4.4 Not (± 0.037) (pH 4.0) 4.2 Not (± 0.025) (pH 4.0) (± 0.014) (± 0.200) (pH 4.0) A1A-38 4.0 Not (± 0.007) (pH 4.0) 4.0 Not (± 0.002) (pH 3.7) (± 0.014) (± 0.016) (pH 4.0) A1A-70 4.0 Not (± 0.011) (pH 4.0) Not shown Not (± 0.003) (pH 4.0) (± 0.010) (± 0.064) (

pH 3.9) A1A-120 4.0 Not (± 0.008) (pH
pH 3.9) A1A-120 4.0 Not (± 0.008) (pH 4.0) Not shown Not Not Not (± 0.002) (± 0.003) (pH 3.9) A2-0 3.9 Not (± 0.001) (pH 3.9) Not shown Not Not Not (± 0.001) (± 0.005) (pH 3.9) The threshold pH was determined at the pH below which dissolved metal concentrations were significantly greater than 5 times the standard deviation of concentrations in samples at� pH 5.5 Mean standard deviation of dissolved metal concentrations above pH 5.5 Mean standard deviation of dissolved metal concentrations at pH 4.0 Maximum concentration of dissolved metal We judge the threshold pH as that pH below which the mobility of metals (Cu, Zn, and Pb in this case) would likely increase, assuming that metal behavior in the field can be assessed from our column-flow experiments. Aqueous Cr concentrations in all effluent solutions from all columns remained below the FAAS detection limits (DL) (0.17 mg L). Aqueous As, Ba, Cd, Se, and Ag concentrations measured in selected effluent samples using ICP-OES (inductively coupled plasma optical emission sp

ectrometry), were all below our analytic
ectrometry), were all below our analytical detection limits of 0.03 mg As L, 0.008 mg Cd Lmg Se L, and 0.01 mg Ag L, 0.10 mg Ba L. We observed no detectable increase in dissolved concentrations of these metals as a function of pH. For these elements, groundwater standards adopted in North Carolina are 0.05 mg Cr L, 0.05 mg As L0.005 mg Cd L, 0.05 mg Se L, and 0.018 mg Ag LOverall, the significance of our results in this study is that Cu, Pb, and Zn in soils may become mobilized when the soil becomes extremely acid, even when soil metal concentrations are mg/kg. Our laboratory column studies indicate that the soils at the MCALF-Bogue site should be maintained at pHĀ ;&#x-100; 5 to ensure that soil acidification does not reach levels that would substantially increase heavy metal solubility. Mobility of metals in samples from the MCOLF-AtlanticFigure 2.14a and 2.14b contain example data showing the change in pH and concentrations of metals in column effluents as a function of volume of acidified, 0.01 M CaCl throughput for sample (AE) from MCOLF-Atlantic. Appendix figures A2, A4, and A6 contained the data

showing trends of dissolved Cu, Pb, and
showing trends of dissolved Cu, Pb, and Zn as a function of pH on four column experiments from the MCOLF-Atlantic site. Analogous to the pH response exhibited by soil samples from MCALF-Bogue, dissolved metal concentrations in effluents from the MCOLF-Atlantic increased to maxima of 1.38 mg Zn L, 0.25 mg Cu L, and 1.17 mg Pb Lat lowest observed pH levels. Effluent samples from only one of four column experiments contained a substantial release of dissolved Cu, Pb, and Zn were mostly below our detection limits of 0.008 mg Cu L-1 and 0.017 mg Pb LDissolved Zn in effluents over the entire pH range was g Zn L1.38 mg Zn L. Figure 2.15 shows dissolved Cu, Zn, and Pb as a function of pH measured in column effluents on samples taken near the incinerator entrance area (sample OE). The overall greatest concentrations of dissolved Cu, Zn, and Pb were measured in column effluents on this sample. This soil sample contained greater concentrations of Zn, Cu, and especially Pb compared with other sample at MCOLF-Atlantic (Table 1.3b). Other than for this sa

mple, column effluents on soil samples f
mple, column effluents on soil samples from other locations at MCOLF-Atlantic mostly contained dissolved Cu, and Pb at concentrations below our analytical detection limits. Binding with organic matter may contribute in part to the strong retention of Cu and Pb in soil samples from the MCOLF-Atlantic site. The results obtained in this study may be consistent with the relatively higher organic carbon contents of soil samples from the MCOLF-Atlantic site (0.2 to 3.1%) compared with samples from the MCALF-Bogue site (0.07 to 0.7 %). Greater organic matter accumulation may have occurred under the more reduced conditions in soils at the MCOLF-Atlantic site. Fig 2.14a. Dissolved concentrations of copper, chromium, lead, iron, manganese, and zinc in effluent solutions collected from column flow experiment on a soil sample from entrance site (OE), MCOLF –Atlantic. (Detection limits determined in this study were 0.008 mg Cu L0.021 mg Cr L, 0.017 mg Pb L, 0.008 mg Mn L, 0.024 mg Fe L, and 0.009 mg Zn L

Fig 2.14b. Dissolved concentr
Fig 2.14b. Dissolved concentrations of arsenic, barium, cadmium, selenium, and silver in selected effluent solutions collected from column flow Experiment on a soil sample from entrance site (AE), MCOLF-Atlantic. (Detection limits determined in this study were 0.03 mg As L, 0.10 mg Ba L, 0.008 mg Cd L, 0.04 mg Se L, and 0.01 mg Ag L A summary of the threshold pH, means of dissolved metal concentrations above pH 5.5, dissolved metal concentrations at pH 4.0, and maximum concentrations of dissolved metal recorded for four column flow experiments on soils from the MCOLF-Atlantic is given in Table 2.2,. The threshold pH for Cu (Table 2.2) was 3.90 and 4.03 (mean threshold pH = 4.07 ± 0.16) for two soil column flow experiments. Threshold pH for Pb was 4.02 shown in one column sample. The threshold pH for Zn was pHrange of Zn concentrations in column effluent was Zn Lfor samples 0.51.5345678Dissolved metal concentration (mg LFigure 2.15 Dissolved concentrations of copper, lead, zinc in effluent solution for column flow experiment on samp

le from near incinerator entrance at the
le from near incinerator entrance at the MCOLF-Atlantic. over the wide pH range studied (pH 3.8 to 7.1). Column flow studies on soil samples from the MCOLF-Atlantic site showed dissolved Zn, Cu, and Pb concentrations in the column effluent samples increased to maxima of 1.376 mg Zn L, 0.246 mg Cu L1.173 mg Pb L at pH 4.0. The greatest concentration of dissolved Cu (0.246 mg Cu L) and Zn (1.376 mg Zn L) in column effluent was less than groundwater standards adopted in North Carolina (NC-DEHNR, 1993). The greatest concentration of dissolved Pb (1.173 mg Pb L-1 at pH 4.0) was measured in column effluents from the column study on soils taken from near the incinerator entrance area (sample OE). This level of Pb is 78-fold greater than groundwater standards of 0.015 mg Pb L adopted in North Carolina (NC-DEHNR, 1993). Based on our data from column flow studies, dissolved concentrations of Pb can be maintain at minimal levels by maintaining soil pH above 4.0. Dissolved chromium was not detected in any column effluent samples. Dissolved As, Cd, Se, and

Ag concentrations in effluent solutions
Ag concentrations in effluent solutions also remained below the analytical detection limits. Under the conditions of accelerated acidification studied, trends of dissolved Cu and Pb at pH 4.0 were not significantly different for both sites (p =0.05), despite different apparent drainage. In constrast, Tack et al. (1996) found the higher solubility of Cu, Pb, Zn, and Cd as a function of pH in the oxidized sediments as compared to the reduced sediments. The low solubility of Cu, Pb, and Zn in reduced soils is typically explained by the presence of sulfides. Table 2.2. Summary of dissolved concentrations of selected metals in effluent samples of column flow experiments on soil samplfrom the MCOLF-Atlantic site. Copper Lead Zinc Column Samples Threshold Dissolved Cu � pH 5.5 (mg LDissolved Cu at pH 4.0 (mg LMaximum dissolved Cu (mg LThreshold Dissolved Pb �pH 5.5 (mg LDissolved Pb at pH4.0(mg LMaximum dissolved Pb (mg LThreshold Dissolved Zn �pH 5.5 (mg LDissolved Zn at pH4.0(mg LMaximum dissolved Zn (mg L4.0 Not (± 0.045) (pH 4.0) 4.0 Not (± 0.5) (pH 4.0) (± 0.0

30) (± 0.098) (pH 4.0) OW Not shown No
30) (± 0.098) (pH 4.0) OW Not shown Not (± 0.004) (pH 4.0) Not shown Not Not Not (± 0.007) (± 0.063) (pH 4.0) O2-70 3.9 Not (± 0.003) (pH 3.8) Not shown Not Not Not Not shown (± 0.002) (± 0.001) (pH 3.9) O4-0 Not shown Not (± 0.005) (pH 4.0) Not shown Not Not Not (± 0.001) (± 0.001) (pH 3.9) The threshold pH was determined at the pH below which dissolved metal concentrations were significantly greater than 5 times the standard deviation of concentrations in samples at� pH 5.5 Mean standard deviation of dissolved metal concentrations above pH 5.5 Mean standard deviation of dissolved metal concentrations at pH 4.0 Maximum concentration of dissolved metal Comparisons between Cu and Zn concentrations in soil samples and dissolved Cu and Zn at pH 4.0 in column effluents for all of our experiments are depicted in Figure 2.16a and 2.16b. We used the data from eleven column experiments on soil samples from the MCALF-Bogue site and the MCOLF-Atlantic site to determine the relationship between dissolved metal concentratio

ns and soil metal concentrations. Efflu
ns and soil metal concentrations. Effluent concentrations of Cu at pH 4 could be related with soil Cu using a linear model (rFigure 2.16a). The relationship between dissolved Zn and total soil Zn (r= 0.80, Figure 2.16b), could be fit with a linear model, but may be even better represented by a quadratic model (r= 0.95). To determine the best models for the data in figures 2.16a and 2.16b, additional data from soil samples with intermediate metal concentrations are needed (20 to 50 mg Cu kg, 60 to 100 mg Zn kg. Coefficients of determinations (rwere significant at a probability level of 0.001, indicating that soil metal concentration significantly influenced metal mobility at pH 4. Wu et al. (2000) indicated that the solubility of Cd and Cu is dominantly related to total concentration in soils. Statistical treatment of data from analyses of relationships between soil properties, including organic matter and CBD extractable Fe contents, and dissolved metal concentrations at pH 4 showed no significant correlations. The retention of Cd, Cu, Pb, and Zn tends to be controlled in oxidized sediments by the presence of

iron oxides and organic matter. The si
iron oxides and organic matter. The significant quantities of oxalate- and CBD-extractable Fe in soil samples from the MCALF-Bogue site (Table 1.1) may reflect the pH effects on adsorption of Cu, Pb, and Zn to Fe-oxide mineral, because metals bound to Fe-oxide mineral tends to become more mobile as pH decreases. The solubility of metal cations typically decreases as pH increases, because adsorption on oxide minerals and organic matter increases or the solubility of metal bearing mineral (e.g. metal carbonate and metal oxides) decreases. It is difficult to assess the relative importance of organic and mineral fractions in controlling metal mobility, because soils consist of mixtures of these adsorbents. Due to the low concentrations of heavy metals in soils studied here, we did not perform bulk EXAFS analysis to further elucidate speciation. However, from our results, it is clear that the mobility of Cu, Pb, and Zn was governed significantly by the factor of soil pH, as would be expected for most adsorbed and precipitated species of heavy meta

l cations. In summary, our results indi
l cations. In summary, our results indicate that if the soils are maintained at pH � 5 (based on Zn data in Table 2.2) the potential mobility and toxicity of any heavy-metal contaminants in soils surrounding the abandoned incinerator at MCOLF-Atlantic is minimal. Figure 2.16a. The relationship between soil Cu concentrations and dissolved Cu at pH 4.0. Red symbols are for MCALF-Bogue, green for MCOLF-Atlantic. Figure 2.16b. The relationship between soil Zn concentrations and dissolved Zn at pH 4.0. Blue symbols are for MCALF-Bogue, orange for MCOLF-Atlantic. Dissolved [Cu] at pH 4.0 (mg LCu concentration (mg kgDissolved [Zn] at pH 4.0 (mg L2Zn concentration (mg kgy = 0.0002x - 0.0106x + 0.1443 R = 0.95 Analysis of Chromium Oxidation State XANES spectra (Figure 2.17) indicated that the proportion of Cr(VI) relative to Cr(III) was greater in two samples of AW2 soil collected from columns after preliminary acid

ification experiments. One sample showed
ification experiments. One sample showed 42 mol % of Cr as Cr(VI) (column sample AW2- May 2001 beamtime) and another showed 6 mol % of Cr as Cr(VI) (column sample AW2- August 2001 beamtime). Due to the impacts of rapid acidification, substantial Mn dissolution might occur, and this reaction possibly induces Cr oxidation. XANES analyses of several additional subsamples of the original soil AW2 showed no evidence for significant quantities of Cr(VI). Cr K-XANES spectra for several subsamples from a sample (AW2) indicated Cr(VI) was not detectable. Also, the XANES spectra for soil collected from columns after several flow experiments (Figure 2.18) showed that the less mobile and potentially less toxic Cr(III) was dominant. No detectable Cr oxidation occurred during acidification of sample AW2 in a column flow experiment using homogeneously mixed subsamples of soil. Therefore, we conclude that some or all of the Cr(VI) found in two column samples might be a result of heterogeneity of the soil sample, in which some Cr(VI) was distributed in a highly localized spot in the part of the soil sample irradiated by t

he 1mm x 10 mm x-ray beam. It is not eas
he 1mm x 10 mm x-ray beam. It is not easy to evaluate the potential hazard in soil containing Cr, because the chemistry of chromium is complex. For example, oxidation reactions of Cr(III) may occur simultaneously with reduction of Cr(VI) in heterogeneous soils containing organic matter, Fe(II), and Mn(III,IV) hydroxides and oxides (James, 1996). 0.559926000600860166024603260406048Normalized fluorescence yieldEnergy (eV)Column sample AW2_May 2001Column sample AW2_August 2001Figure 2.17 Stacked, chromium K-XANES spectra for soil samples collected from columns studied on pH effects of Cr(III) oxidation. One sample showed 42 mol % of Cr as Cr(VI) (column sample AW2- May 2001 beamtime) and another showed 6 mol % of Cr as Cr(VI) (column sample AW2- August ). 0.5599060006010602060306040Normalized fluorescence yieldEnergy (eV)Cr(III) standard10 mol% Cr(VI) standard9days_pH4.09days_pH7.03days_pH7.00days_pH7.03days_pH4.00days_pH7.0Figure 2.18 Stacked, chromium K-XANES spect

ra for soil samples collected from colum
ra for soil samples collected from columns studied on pH effects of Cr(III) oxidation. Effect of Redox Potential Figure 2.18 shows the redox potentials and concentrations of dissolved Cu, Pb, Zn, Cr, Fe, and Mn measured during the incubation study on five selected samples from the MCALF-Bogue site. The Eh decreased slightly in all solutions during incubation with dextrose, and ranged from 397 to 352 mV for AW, 455 to 408 mV for AE, 325 to 258 mV for A1A-38, 275 to 261 mV for A1A-70, 312 to 302 mV for A1A-120. pH values increased with decreasing Eh in some samples, as expected. (Patrick et al., 1996; Lindsay, 1979). The data showed a slight increase in dissolved Zn concentrations (to 0.05 mg L) after 10 days of incubation (Figure 2.18), with increasing dissolved Fe/Mn concentration in two samples. A maximum concentration of 0.04 mg Zn Lfrom sample (A1A-38)at 10 days. Dissolved Mn concentration in solutions increased to maxima of 0.35 mg Mn L. This result was consistent with the higher solubility of manganese by reductive dissolution of Mn oxides

. Dissolution of Fe and Mn oxides can a
. Dissolution of Fe and Mn oxides can also induce trace metal mobilization, since they are specific sorbents of heavy metals, particularly Pb, Zn, and Cd (Kinniburgh and Jackson, 1981). However, Fe and Mn concentrations decreased in samples collected after 20 and 30 day incubations. Precipitation of Fe/Mn carbonates may occur at the pH values of these samples, as may hydrozincite (Zn(COExcept for Zn, dissolved Cu, Pb, and Cr remained below the FAAS detection limit for each soil sample, indicating that these metals might not be released significantly as redox potential decreased by crease of Eh may not occur in this oxidized soil unless the soil was exposed to prolonged flooding. Overall, our results indicated that only slight dissolution of Zn (mg L) and no detectable dissolution of Cu or Pb occurred when samples of soils surrounding the MCALF-Bogue site was exposed to a decrease in redox potential of Figure 2.19 Dissolved Cu, Pb, Zn, Cr, Fe, and Mn concentrations in supernatant

solutions from five selected soil sample
solutions from five selected soil sample suspensions from MCALF-Bogue,after 0, 10, 20, and 30 day incubations with 0.2% dextrose. CONCLUSIONS The data obtained in this column flow and incubation studies determined that the dissolution of heavy metals in soils containing low metal concentrations (100 mg/kg) are strongly pH-dependent at pH Zn, pH studies on soil samples from the MCALF-Bogue incinerator site determined that with decreasing pH, dissolved Zn, Cu, and Pb concentrations in the column effluent samples increased to maxima of 0.16 mg Zn L, 0.054 mg Cu L, and 0.045 mg Pb L between pH 4.1 and 3.8. For MCOLF-Atlantic soil samples, dissolved concentrations increased to maxima of 1.38 mg Zn L, 0.25 mg Cu L, and 1.17 mg Pb L between pH 4.0 and 3.8. Threshold pH levels below which increasing metal dissolutions were obtained, are pH 4.1 0.2 for Cu, pH r Pb, and pH 4.6 0.4 for Zn for the MCALF-Bogue site, and 0.2 for Cu, pH 0.2 for Zn for the MCOLF-Atlantic site. These data indicate that the soils at these sites should be maintained at &#x 4.0;

&#x for;&#x Pb,;&#x and;&#x pH ;.2 ;
&#x for;&#x Pb,;&#x and;&#x pH ;.2 ;pH 5 to minimize mobility of metals left in place. For all 11 columns studied, effluent concentrations of Cu and Zn at pH 4 were related by linear (or quadratic) model to soil metal concentrations r= 0.80 for Zn. Dissolved chromium was not detected in any effluent samples. Dissolved As, Cd, Se, and Ag concentrations in selected column effluent solutions also were below our analytical detection limits. There was no strong apparent effect of acidification treatment on dissolved concentrations of these elements. Synchrotron XANES spectra of soil samples before and after a column acidification treatment showed no evidence for Cr(III) oxidation to Cr(VI) in a sample of higher Cr concentration taken near the window at the MCALF-Bogue site, suggesting that Cr in samples was stable in its less mobile and potentially less toxic Cr(III) form. During 30 day incubation studies with dextrose to promote reduction, only dissolved Zn in suspensions was detectable and reached maximum concentrations of 0.04 mg Zn L-1 the r

edox potential decreased by as 260 mV.
edox potential decreased by as 260 mV. Dissolved Cu, Pb, and Cr concentrations remained below our analytical detection limits. Overall, our data suggest that the metals at the incinerator sites can be managed in place (in-situ remediation), mainly by monitoring and regulating soil pH atPmV;&#x to ; s l;&#xow-8;&#x.100; pH5, e.g., through periodic liming or perhaps by making the soils calcareous using less frequent, larger lime treatments. REFERENCES Alcacio, T. E., D. Hesterberg, W. Zhou, J. D. Martin, S. Beauchemin, and D. E. Sayers. 2001. Molecular scale characteristics of Cu(II) bonding in goethite-humate complexes. Geochimica et Cosmochimica Acta 65:1355-1366 Alesii, B.A., W.H. Fuller, M.V. Boyle. 1980. Effect of leachate flow rate on metal migration through soil. J. Environ. Qual. 9:119-126. Calmano, W. J. Hong, and U. Forstner. 1993. Binding and mobilization of heavy metals in contaminated sediments affected by pH and redox potential. Wat. Sci. Tech. 28:223-Calmano, U. Forstner and W. J. Hong. 1994. Mobilization and scavenging of

heavy metals following resuspension of
heavy metals following resuspension of anoxic sediment from the Elbe River. In Alpers and D.W. Blowes (ed.). Environmental geochemistry of sulfide oxidation. American Chemical Society, US. p. 298-321. Camobreco, V.J., B.K. Richards, T.S. Steenhuis, J.H. Peverly, and M.B. McBride. 1996. Movement of heavy metals through undisturbed and homogenized soil columns. Soil Chuan, M.C., G.Y. Shu, and J.C. Liu. 1996. Solubility of heavy metals in a contaminated soil: Effects of redox potential and pH. Water Air Soil Pollut. 90, pp. 543-556, 1996. Gambell, R.P. 1994. Trace and toxic metals in wetlands- a review.J.Environ.Qual. Forstner, U. 1991. in G.H. Bolt et al. (eds.), Interaction at the soil colloid-Soil Solution Interface, NATO ASI series, Kluwer Academic Publishers, Dordrecht, The Netherlands, Francis, A. J. and C. J. Dodge. 1990. Anaerobic microbial remobilization of toxic metals coprecipitated with iron oxides. Environ. Sci. Technol. 24:373-378. Hansen, Paul D. 1997. Chemical speciation and dissolution of copper, lead and zinc in a contaminated soil as affected by Redox potential. M.S. Thesis. North Carolin

a State University, pp. 36-38,51-60, & 6
a State University, pp. 36-38,51-60, & 64. Hesterberg, D. 1998. Biogeochemical Cycles and Processes Leading to Changes in Mobility of Chemicals in soils. Agric. Ecosyst. Environ.67:121-133. Hesterberg, D. 2001. Soild-phase speciation and stability of soil heavy metal contaminants at the MCALF-Bogue and MCOLF-Atlantic incinerator sites. I. Metal concentrations, oxidation state of chromium and arsenic, and soil characteristics. First report to the Marine Corps Air Station (MCAS), Cherry Point. James, B.R. 1996. The challenge of remediating chromium-contaminated soil. Environ. Sci. Technol. 30:248-251. Johnston, A. E., Goulding, K.W.T., P. R. Poulton. 1986. Soil acidification during more than 100 years under permanent grassland and woodland at Rothamsted, Soil Use and Management, 2, 3-10. Klesta, E.J. and J.K. Bartz. 1996. Quality assurance and quality control. p. 19-48In D.L.Sparks (ed.) Methods of soil analysis, Part 3. Chemical methods, ASA-SSSA, Madison, WI. Kinniburgh, D.G., Jackson, M.L., and Syers, J.K. (1976), “Adsorption of Alkaline Earth

,Transition, and Heavy Metal Cations by
,Transition, and Heavy Metal Cations by Hydrous Oxide Gels of Iron and Aluminum,” Soil Sci. Soc. Am. J., 40: 796-800. Lindsay, W.L. 1979. Chemical equilibria in soils. John Wiley and Sons, New York. NC-DEHNR (North Carolina Department of Environment, Health, and Natural Resources). 1993. Classifications and water quality standards applicable to the ground waters of North Carolina. Title 15A. Subchapter 2L. Sections .0100,.0200,.0300. Manceau A., Charlet L. 1992. X-ray absorption spectroscopic study of the sorption of Cr(III) at the oxide/water interface. I. Molecular mechanism of Cr(III) oxidation on Mn oxides. Journal of Colloid and Interface Science, 148, 443-458. Sheppard, M.I., Thibault, D.H. 1991. A four-year mobility study of selected trace elements and heavy metals. J. Environ. Qual. 20:101-114. McBride, M.B. 1989. Reactions controlling heavy metal solubility in soils. pp. 1-56 In B.A. Stewart (ed.) Adv. in Soil Sci., vol. 10, Springer-Verlag Publ. Co., New York. McBride, M.B. 1994. Environmental Chemistry of Soils. Oxford University Press, New McGeehan, S. L., Naylor, D. V.1994. "Sorption and Redox Trans

fomation of Arsenite and Arsenate in Two
fomation of Arsenite and Arsenate in Two Flooded Soils", Soil Sci. Soc. Am. J., 58, 337-342. McLaren, R.G., J. G. Willams, and R.S. Swift. 1983. Some observations on the desorption and distribution behaviour of copper with soil components. J. Soil Sci. Patrick, W. H., R. P. Grambrell, and Faulkner. 1996. Redox measurement in soils, p. 1255-1273 In D.L.Sparks (ed.) Methods of soil analysis, Part 3. Chemical methods, ASA-SSSA, Madison, WI. Pickering, W.F., 1988. Copper in the environm. Part I: ecological Cycling. Ed. Nriagu, J.O.; John Wiley, New York; pp. 217-253. SAS/STAT User's Guide, 4th ed; SAS Institute Inc.: Cary, NC, 1990; pp 1162-Sposito, G. 1983. The chemical forms of trace metals in soils. p.123-170. In “Applied Environmental Geochemistry”. (Ed). Thornton, I. Academic Press Inc. London. Stevenson F.J. 1976. Stability constants of Cu complexes with humic acids, Soil Sci. Soc .Am. J., 40:665 –672. Tack, F.M., O.W.J.J. Callewaert, and M.G. Verloo. 1996. Metal solubility as a function of pH in a contaminated, dredged sediment affected by o

xidation. Environ. Poll. Wu, Q., Henders
xidation. Environ. Poll. Wu, Q., Hendershot, W.H., Marshall, W.D. and Ge, Y. 2000. Speciation of Cadmium, Copper, lead and Zinc in Contaminated Soils. Commun. Soil Sci. Plant Anal., 31 (9&10), Zachara, J.M., S.C. Smith, C.T. Resch, and C.E. Cowan. 1992. Cadmium sorption to soil separates containing layer silicates and iron and aluminum oxides. Soil Sci. Soc. Am. J. APPENDIX FIGURES(Results of Column Flow Studies)0.060.110.170.230.280.060.110.170.230.280.060.110.170.230.28AW20.060.110.170.230.28A2_0345678Dissolved [Cu] (mg LFigure A1. Dissolved [Cu] concentrations in effluent samples collected from columns of soils from the MCALF-Bogue site as a function of pH. (Detection limit determined in this study was 0.008 mg Cu LMCALFEntrance(0-25 cm)MCALFWindow(0-25 cm)MCALFWindow(0-25 cm)MCALFLocation 2(0-25 cm)0.060.110.170.230.28A1A-700.060.110.170.230.28A1A-380.060.110.170.230.28A1A-120345678Dissolved [Cu] (mg LFigure A1. (Continued)MCALFLocation 1A(38-70 cm)MCALFLocation 1A(70-120 cm)MCALFLocation 1A(120-150 cm)0.060.110.170.230.280.060.110.170.230.280.060.110.170.230.280.060.110.170.230.28345678Dissolved

[Cu] (mg LFigure A2. Dissolved [Cu] conc
[Cu] (mg LFigure A2. Dissolved [Cu] concentrations in effluent samples collected from columns of soils from the MCOLF-Atlantic site as a function of pH. (Detection limit determined in this study was 0.008 mg Cu LMCOLFEntrance(0-25 cm)MCOLFWindow(0-25 cm)MCOLFLocation 2(70-100 cm)MCOLFLocation 4(0-25 cm)00.220.440.881.10.220.440.660.881.10.220.440.660.881.1AW20.220.440.660.881.1A2-0345678Dissolved [Zn] (mg LFigure A3. Dissolved [Zn] concentrations in effluent samples collected from columns of soils from the MCALF-Bogue site as a function of pH. (Detection limit determined in this study was 0.009 mg Zn LMCALFEntrance(0-25 cm)MCALFWindow(0-25 cm)MCALFWindow(0-25 cm)MCALFLocation 2(0-25 cm)0.220.440.660.881.1A1A-380.220.440.660.881.1A1A-700.220.440.660.881.1A1A-120345678Dissolved [Zn] (mg LFigure A3. (Continued)MCALFLocation 1A(38-70 cm)MCALFLocation 1A(70-120 cm)MCALFLocation 1A(120-150 cm)0.220.440.660.881.10.220.440.660.881.10.220.440.660.881.1O2-700.220.440.660.881.1345678Dissolved [Zn] (mg LFigure A4. Dissolved [Zn] concentrations in effluent samples collected from columns of soils from the MCOLF-Atla

ntic site as a function of pH. (Detectio
ntic site as a function of pH. (Detection limit determined in this study was 0.009 mg Zn LMCOLFEntrance(0-25 cm)MCOLFWindow(0-25 cm)MCOLFLocation 2(70-100 cm)MCOLFLocation 4(0-25 cm)0.040.070.110.140.180.040.070.110.140.180.040.070.110.140.18AW20.040.070.110.140.18A2-0345678Dissolved [Pb] (mg LFigure A5. Dissolved [Pb] concentrations in effluent samples collected from columns of soils from the MCALF-Bogue site as a function of pH. (Detection limit determined in this study was 0.017 mgPbLMCALFEntrance(0-25 cm)MCALFWindow(0-25 cm)MCALFWindow(0-25 cm)MCALFLocation 2(0-25 cm)0.040.070.110.140.18A1A-380.040.070.110.140.18A1A-700.040.070.110.140.18A1A-120345678Dissolved [Pb] (mg LFigure A5. (Continued)MCALFLocation 1A(38-70 cm)MCALFLocation 1A(70-120 cm)MCALFLocation 1A(120-150 cm)0.220.450.670.91.120.040.070.110.140.180.040.070.110.140.180.040.070.110.140.18345678Dissolved [Pb] (mg LFigure A6. Dissolved [Pb] concentrations in effluent samples collected from columns of soils from the MCOLF-Atlantic site as a function of pH. (Detection limit determined in this study was 0.017 mgPbLMCOLFEntrance(0-25 cm)MCOLFW