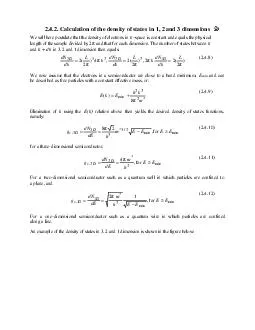
PDF-x0000x0000Heat Index Calculation and Chart
Author : audrey | Published Date : 2022-10-13
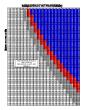
79 80 81 82 83 84 85 86 87 88 89 90 91 92 93 94 95 96 97 98 99 100 84 87 91 95 99 103 107 112 116 121 126 132 137 143 149 155 161 168 174 181 188 99 84 87 91 94 98 102 106 111 116 120 125 131 136 142
Presentation Embed Code
Download Presentation
Download Presentation The PPT/PDF document "x0000x0000Heat Index Calculation and Cha..." is the property of its rightful owner. Permission is granted to download and print the materials on this website for personal, non-commercial use only, and to display it on your personal computer provided you do not modify the materials and that you retain all copyright notices contained in the materials. By downloading content from our website, you accept the terms of this agreement.
x0000x0000Heat Index Calculation and Chart: Transcript
Download Rules Of Document
"x0000x0000Heat Index Calculation and Chart"The content belongs to its owner. You may download and print it for personal use, without modification, and keep all copyright notices. By downloading, you agree to these terms.
Related Documents