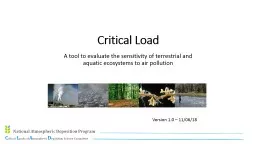
/
Critical Load A tool to evaluate the sensitivity of terrestrial and aquatic ecosystems Critical Load A tool to evaluate the sensitivity of terrestrial and aquatic ecosystems

Critical Load A tool to evaluate the sensitivity of terrestrial and aquatic ecosystems - PowerPoint Presentation

ava
ava . @ava
Follow
342 views
Uploaded On 2022-06-28

Critical Load A tool to evaluate the sensitivity of terrestrial and aquatic ecosystems - PPT Presentation

Version 10 110618 Source and Reference for Presentation This presentation was produced by the National Atmospheric Deposition NADPCritical Loads of Atmospheric Deposition CLAD Science Committee Executive Team as a source of information and slides for presentations that include critic ID: 928077

load critical loads deposition critical load deposition loads species aquatic change effects clad biological ecosystem slides surface presentation nitrogen

Share:

Link:

Embed:

Download Presentation from below link

Download Presentation The PPT/PDF document "Critical Load A tool to evaluate the sen..." is the property of its rightful owner. Permission is granted to download and print the materials on this web site for personal, non-commercial use only, and to display it on your personal computer provided you do not modify the materials and that you retain all copyright notices contained in the materials. By downloading content from our website, you accept the terms of this agreement.


Presentation Transcript

Slide1

Critical Load

A tool to evaluate the sensitivity of terrestrial and aquatic ecosystems to air pollution

Version 1.0 – 11/06/18

Slide2

Source and Reference for Presentation

This presentation was produced by the National Atmospheric Deposition (NADP)–Critical Loads of Atmospheric Deposition (CLAD) Science Committee Executive Team as a source of information and slides for presentations that include critical loads.

It is a product of NADP–CLAD. Any opinions, findings, conclusions, or recommendations as part of the slides and information herein do not necessarily reflect the views of CLAD, NADP, and/or respective members’ affiliations.Please use the following as a reference for this presentation and/or individual slides from this presentation:

Phelan, J.N., Cummings, T.G., Bell, M.D., and Lynch, J.A. 2018. Critical Load – a tool to evaluate the sensitivity of terrestrial and aquatic ecosystems to air pollution (version 1.0). National Atmospheric Deposition Program, Wisconsin State Lab of Hygiene, University of Wisconsin – Madison, Madison, WI.

Slide3

Critical Load Presentation Information and Guidance

This set of slides is meant to be a living document that serves as a resource for individuals making presentations related to critical loads of atmospheric deposition. The slides provide a broad overview of critical load science varying from simple definitions to complex biogeochemical relationships. The intent of including all of the information in the same format, is that when users pull from the presentation based on their needs (i.e., the user can use all or only some of the slides, based on their needs), the messaging will remain consistent across audiences. As the use of critical loads in a policy context has not been codified among agencies, this topic was intentionally left vague, with the expectation that a user will

develop their own management or policy slides, based on their agency or organization priorities.If you add content/information (and would like to contribute to this presentation), please use the following points as guidance:If you add information, specific examples, etc., please add your name and date beside each note in the notes field of the slide.If you add a new slide, please add your name and date in the notes field of the new slide.

If you make additions to a slide, please describe the additions in the notes field (along with your name and date).Please send inquiries, comments, and changes to the presentation to NADP–CLAD Program Manager – Jennifer Phelan (Jennifer.Phelan@slh.wisc.edu)

Slide4

Abbreviations in Presentation

Al – aluminum

NH

3

– ammoniaARP – Acid Rain Program (U.S. EPA)

NH4+ – ammonium

BLM – U.S. Bureau of Land Management

NO

3

-

– nitrate

C – carbon

NPS – U.S. National Park Service

CL – critical load

NO

x

– oxides of nitrogen

CLAD – Critical Loads of Atmospheric Deposition Science Committee of NADP

NYSERDA – New York Energy Research and Development Authority

CSPAR – Cross-State Air Pollution Rule

PM – particulate matter

EPA – U.S. Environmental Protection Agency

S – sulfur

FWS – U.S. Fish and Wildlife Service

SO

2

– sulfur dioxide

H

2

SO

3

– sulfurous acid

SO

4

2-

– sulfate

H

2

SO

4

– sulfuric acid

SO

x

– oxides of sulfur

HNO

3

– nitric acid

TDEP – Total Deposition (deposition

dataset

)

N – nitrogen

TNC – The Nature Conservancy

NADP – National Atmospheric Deposition Program

USFS – U.S. Forest Service

NCLD – National Critical Load Dataset

WSU – Washington State University

Slide5

Nitrogen (N) and Sulfur (S) Air Pollution

http://www.mrgscience.com/ess-topic-63-photochemical-smog.html

Slide6

Nitrogen (N) Species

Inorganic N:Oxides of N (NOx)

Industrial and vehicle sources (combustion of fossil fuels) LightningPrecursor to ozone and particulate matter (PM)Forms nitric acid (HNO

3) in atmosphere; component of acid rainAmmonia (NH3)Predominantly agricultural sources (application of fertilizers)Also from mobile sources with catalytic reductionPrecursor to PMBecomes ammonium (NH

4+) in atmosphere (in precipitation)Organic NCan be a significant contribution, but is less understood

Slide7

Annual Oxides of N (NOx) Emissions from CSAPR and ARP Sources, 1990-2015

https://www3.epa.gov/airmarkets/progress/reports/emissions_reductions_nox.html

Slide8

Sulfur (S) Species

Oxides of S (SOx)Industrial sources; mainly combustion of coal and oil

Forms sulfurous acid (H2SO3) and sulfuric acid (H2

SO4) in the atmosphere; components of acid rainPrecursor to PM

Slide9

Oxides of S (SO2) Emissions from CSAPR and ARP Sources, 1980-2015

https://www3.epa.gov/airmarkets/progress/reports/emissions_reductions_so2.html#figure1

Slide10

Why do we care?

Air pollution deposits to ecosystems in the form of wet and dry N and S deposition

Slide11

https://nature.nps.gov/air/Studies/criticalLoads/DepExplain.cfm

N and S Pollution Transport and Fate

Slide12

Nitrogen (N) Deposition – TDEP (2013-2015)

NO

y

NHx

Total Nftp://ftp.epa.gov/castnet/tdep/images/

Slide13

Sulfur (S) Deposition – TDEP (2013-2015)

ftp://ftp.epa.gov/castnet/tdep/images/

Slide14

Why do we care?

Air pollution deposits to ecosystems in the form of wet and dry N and S deposition

N and/or S deposition negatively impact the biota in terrestrial and aquatic ecosystems and the services they provide

Slide15

How do N and S deposition negatively impact ecosystems?

Eutrophication – excess N:Fertilizing effect in soils and drainage/surface waters (lakes, streams, and estuaries)

Acidification – excess S and/or N:Acidifies soils and drainage/surface waters

Slide16

Eutrophication – excess N

Fertilizing effect:Terrestrial and aquatic mechanisms:N is the limiting nutrient to growth in many terrestrial and aquatic ecosystems

Excess N stimulates growth in many ecosystemsExcess N changes competitive interactions and advantage, leading to changes in composition and diversityIncreased nitrate (NO

3-) leaching to drainage/surface waters

Slide17

Acidification – excess N and/or S

Acidifies soils and drainage/surface waters:Terrestrial mechanisms:Increased aluminum (Al) in soil solution; Al is toxic to many plant species

Leaching of base cations from rooting zone of soil; loss of nutrients and creation of nutrient imbalanceSpecies of plants, trees, mycorrhizae, and lichens differ in their sensitivity to these conditions

Aquatic mechanisms:Leaching of sulfate (SO42-) and NO3- leading to export of base cations and decreased pH and ANC in drainage/surface watersIncreased Al in drainage/surface waters; Al is toxic to many aquatic species

Species of aquatic macroinvertebrates, algae, and fish differ in their sensitivity to these conditions

Slide18

How is N and/or S deposition negatively impacting your system?

Eutrophication OR Acidification?

*** mechanism is often not certain because N can act as a fertilizer and acidifying agent, and N and S deposition are often correlated; both mechanisms can be occurring in an ecosystem***

Slide19

Ecosystem Effects of N Deposition

Annual Plants:Increased or decreased primary productivityIncreased mortalityChanges in community composition

Loss of biodiversity Spread of invasive species

Invasive grass (Schismus

spp.)in Sonoran Desert (Photo: E. Allen)

Slide20

Ecosystem Effects of N Deposition

Lichens:Changes in community compositionIncreases in nitrophilic

/eutrophic speciesLoss of biodiversityExtirpation

Wolf lichen

Slide21

Ecosystem Effects of N Deposition

Forests:Loss of mycorrhizae

Increased and decreased tree growth Increased mortality of treesChanges in forest compositionLoss of biodiversity

Ponderosa pineEastern hemlock

Red elm

Ectomycorrhizae

Tiarella

cordifolia

Slide22

Ecosystem Effects of N Deposition

Drainage/Surface waters:Increased algal and/or cyanobacterial growthDecline in diatom diversity

Changes in composition of aquatic biotaTogether with other sources of nitrogen can lead to algal bloom

Gyrosigma

acuminatum (diatom)

Slide23

Ecosystem Effects of Acidifying N and S Deposition

Terrestrial Ecosystems:Decreased tree growth

Increased mortality of treesDecreased survival of seedlingsChanges in forest compositionLoss of biodiversity

Sugar maple

Red spruce

Yellow birch

Slide24

Ecosystem Effects of Acidifying N and S Deposition

Drainage/Surface waters:Loss of aquatic biodiversity

Reduced population health, reproduction capacity, and fitnessLoss of fish, macroinvertebrate, and amphibians from streams/lakes

Slide25

So, how much deposition is too much?

Critical Load

A quantitative estimate of exposure to one or more pollutants below which significant harmful effects on specified sensitive elements of the environment do not occur according to present knowledge (Nilsson and Grennfelt

1988; UBA, 2004).

https://www.srs.fs.usda.gov/airqualityportal/critical_loads/cls_background.php

Slide26

Components of a

Critical Load

Deposition either:

directly impacts biota, orchanges soil or water chemistry that impacts biota

Changes to soil or water chemistry exceed a threshold amount beyond which biota (biological receptor) is negatively impactedChange in biological receptor (biological response) exceeds a threshold amount

Slide27

N deposition (kg/ha/

yr

)

Forest ecosystem critical loads

Change in lichen species composition

Change in herb diversity

Critical Load

Critical loads are defined for specific biological indicators, receptors, or endpoints

Critical load values differ and reflect different sensitivities of different biological indicators to deposition

Biological receptors can have a range of critical load values; sensitivities can vary by location

Sensitivity

CL = 1.5-12.7 kg N/ha/

yr

CL = 3-39 kg N/ha/

yr

CL = 7.9-19.6 kg N/ha/

yr

Slide28

Change in Water Quality with increasing

N and S deposition (kg/ha/

yr

)

Reduction in non-sensitive fish species

Change in macroinvertebrate community

Change in diatom

species composition

Reduction in sensitive fish species

Critical Load

Critical loads are defined for specific biological indicators, receptors, or endpoints

Critical load values differ and reflect different sensitivities of different biological indicators to deposition

Biological receptors can have a range of critical load values; sensitivities can vary by location

Sensitivity

e.g.,

Blacknose

dace

e.g., brook trout

Change in algal

species composition

Slide29

How are critical loads determined?

Empirical critical load:involves observed spatial or temporal gradient studies or experimental manipulations of pollutants applied to sites or landscapes that are ecologically comparable to location(s) from which critical loads were determined

Steady-state mass balance critical load:derived from mathematical mass-balance models under assumed or modeled equilibrium conditionsmodels vary in complexity with regard to process representation

Slide30

Examples of Critical Load maps

Aquatic Acidification – 10

th

quartile (aggregated by 12-km grid cells)http://nadp.sws.uiuc.edu/committees/clad/db/NCLDMapSummary_2016.pdf

Aquatic Acidification (by location)

Slide31

http://nadp.sws.uiuc.edu/committees/clad/db/NCLDMapSummary_2016.pdf

Examples of Critical Load maps

Slide32

What happens if deposition is greater than a critical load?

Critical Load Exceedance

The critical load is exceeded if the deposition load of a pollutant is greater than or equal to the critical load of the pollutant for the same location.

In mathematical terms, the exceedance (Ex) of the critical load CL(X) is given as: Ex(Xdep) = Xdep

– CL(X)The source of the deposition load estimate is defined by the user.

Slide33

Examples of Critical Load Exceedance maps

Slide34

N deposition (kg/ha/

yr

)

Change in Biological Receptor D

Change in Biological Receptor B

Change in Biological Receptor A

Change in Biological Receptor C

Critical Load Exceedance

Sensitivity

A

B

C

D

Critical Loads for A and B are exceeded

CL = 0.3 kg N/ha/

yr

CL = 0.5-1.0 kg N/ha/

yr

CL = 2-3kg N/ha/

yr

CL = 5-10 kg N/ha/

yr

Slide35

What happens when a critical load is exceeded?

Biological indicator is negatively impactedBiological responses:Increased or decreased growth

Decreased survivalLoss of speciesReduced biodiversity Change in species composition

Disruptions in food web dynamics Response may not occur immediately

Slide36

How are critical loads used?

State agencies – risk assessment and policy development (e.g., NYSERDA)

Federal agencies – in support of natural resource/land management (e.g., NPS, USFS, BLM, and FWS) policy and pollution standard development and review (e.g., EPA)Non-Governmental Organizations –

assessment tool (e.g., The Nature Conservancy)

Slide37

Critical Load Tools and Resources

EPA Critical Loads Mapper Tool

US Forest Service Air Quality Portal for Land Management PlanningUSFS N-CLASNational Park Service

USDA Forest ServiceUNECE - Modeling and MappingUNECE - Coordinating Center for EffectsNADP-CLAD

Slide38

NADP-CLAD

Critical Loads of Atmospheric Deposition (CLAD) Science Committee of the National Atmospheric Deposition Program (NADP) in the U.S

Established in 2010 Multi-agency group consisting of federal and state government agencies, non-governmental organizations, environmental research organizations, and universities.Goals:facilitate sharing of technical information on critical loads topics within a broad multi-agency/entity audience

fill gaps in critical loads development in the U.S.provide consistency in development and use of critical loads in the U.S.promote understanding of critical loads approaches through development of outreach and communications materialshttp://nadp.sws.uiuc.edu/committees/clad/

Slide39

NADP-CLAD - Products

National Critical Load Database (NCLD)

Developed and updated using published research (and data) produced by CLAD members and other scientists in the U.S.Critical Load Types within NCLD:

Terrestrial Forest Soil AcidificationAquatic Surface/Drainage Water AcidificationEmpirical Critical Load of Nitrogen:Forest ecosystemsHerbaceous species and shrubsHerbaceous biodiversity

Mycorrhizal fungiLichensNitrate LeachingCritical Load Maps

Slide40

References Cited

Nilsson, J. and P. Grennfelt. 1988. Critical loads for sulphur and nitrogen. Report from a workshop held at

Skokloster, Sweden 19-24 March 1988. Miljorapport 15, 1-418.UBA (UmweltBundesAmt). 2004. Manual on methodologies and criteria for mapping critical levels/loads and geographical areas where they are exceeded. Federal Environmental

Agency (UmweltBundesAmt), Berlin, Germany. http://www.rivm.nl/en/themasites/icpmm/manual-and-downloads/manual-english/index.html.

Slide41

Acknowledgements

Presentation was developed by NADP-CLAD Executive Team (Jennifer Phelan, Tonnie Cummings, Jason Lynch, and Michael Bell)Slides and/or content were contributed by Tamara Blett (NPS), Linda Pardo (USFS), Linda

Geiser (USFS), Ellen Porter (NPS), and Rebecca Evans (WSU)Sources of data and figures are acknowledge on slidesCited references are listed in the References cited slide

Slide42

Slide43

EXTRA SLIDES / LIBRARY OF ADDITIONAL CL SLIDES

The following slides are extra slides from different CL presentations that are not to include in the slide deck for the CLAD CL presentation, but may be useful for your presentation needsNote: these slides have been copied and pasted from their source (and therefore may not be consistent in style, format or content with main presentation slides)

Slide44

N Load (kg/ ha /

yr

)

Current deposition level

A

B

C

D

E

F

G

H

Changes in soil & water chemistry

Change in aquatic plant species composition

Surface water N saturation

Changes in tree chemistry

Change in alpine

plant species

Effects on aquatic animals (episodic acidification)

Lethal effects on fish, other aquatic animals (chronic acidification)

Forest decline (acidification effects on trees)

A

B

C

D

E

F

G

H

Target Load

Target Load

Slide45

Critical Loads for U.S. Ecosystems

From NADP-CLAD National Critical Load Database (NCLD) v3.0

Slide46

Target Load Definition

The deposition load that is selected or determined to provide a level of protection for or recovery of sensitive ecosystem components based on time frame for resource protection, feasibility of emissions reductions, and/or other considerations.

Target loads can be determined through management or policy considerations, or by using dynamic process-based models that calculate the deposition load that leads to a desired chemical or biological state of an ecosystem in a given future year (Posch et al. 2003). The target load may be set higher or lower than or equal to the critical load. Target load has sometimes been referred to as “dynamic critical load.”

Slide47

Critical Loads and Target Loads

A critical load is based on studies or modeling and is the amount of pollution below which harmful environmental effects are not expected to occur. (Science-based)

A target load identifies an acceptable amount of pollution and is based on policy, economic, temporal, or other considerations. A target load may be higher or lower than a critical load. (Management decision)

Slide48

N Load (kg/ ha /yr)- wet

Changes in soil & water chemistry

Effects on aquatic animals (episodic acidification)

Lethal effects on fish, other aquatic animals (chronic acidification)

Natural background N deposition

Current N deposition in Rocky Mountain NP

Surface water N saturation

Rocky Mountain National Park: Continuum of Impacts to Ecological Health

Changes in tree chemistry

Change in alpine

plant species

Change in aquatic plant species composition

Forest decline (acidification effects on trees)

“weight of evidence” of ecosystem health decline on east side of park

0.2 kg/ha/yr

3.1 kg/ha/yr

1.5 kg/ha/yr

Rocky Mountain National Park: Continuum of Impacts to Ecological Health

Aquatic Ecosystem Critical Load

Slide49

Slide50

Too much of a good thing

Slide51

More invasion

Increased plant available N more accessible by invasive species.Native also enhanced, but often outcompeted by invasives

Can enhance rate of invasion and allowspecies to invadepreviously undisturbed

habitat

Slide52

Critical Load

The threshold of deposition below which specified harmful ecological effects do not occur (Porter et al. 2005)

Biological Responses

Death of Indicator species, Decline in Condition of individuals

Decreased Reproductive Success

Chemical Variables

ANC, pH, Nitrogen,

Base Saturation, Ca/Al

Pollutant Load

SO4, NH4, NO3, Hg, POPs, NOx, SO2

Slide53

Environmental harm caused by acidifying and fertilizing pollutants

Both S and N deposition can acidify surface waters and soils

. ↑acidity lowers water pH, harming fish and invertebrate health. Acidity may harm soil fertility by removing calcium and releasing toxic aluminum, impacting plants and animals.

 N deposition also fertilizes the environment, favoring some plant species and inhibiting others  changing species composition and abundance.  N deposition 

↑ nutrient enrichment in freshwater, coastal, and estuarine ecosystems, which may cause toxic algal blooms, fish kills, and loss of biodiversity.When critical loads are exceeded, the environmental effects can extend over great distances. For example, excess nitrogen can change soil and surface water chemistry, which in turn can cause eutrophication of downstream estuaries. Target loads

are based on critical loads, but can include consideration of the timeframe needed to achieve a desired ecosystem condition as well as incorporating policy or management goals.  

Slide54

Critical load definition

The term critical load

is used to describe the threshold of air pollution deposition that causes harm to sensitive resources in an ecosystem. Critical loads work has

focused on nitrogen (N) and sulfur (S) air pollutants that are deposited into ecosystems.  Critical loads are typically expressed in terms of kilograms per hectare per year (kg/ha/yr) of wet or total (wet + dry) deposition. Critical loads can be developed for a variety of ecosystem responses

, including shifts in microscopic aquatic species, increases in invasive grass species, changes in soil chemistry affecting tree growth, and lake and stream acidification to levels that can no longer support fish. They can be used to assess ecosystem health, guide resource management decisions, and evaluate the effectiveness of emissions reduction strategies.

Slide55

Publically accessible tools in development

USDA-Forest Service Air Quality Portal

(available now)Uses a decision tree format to guide managers to identify areas with CL exceedance and determine potential mitigation activities

https://www.srs.fs.usda.gov/airqualityportal/ USDA-Forest Service N-CLAS tool (in development) Uses a 4-step process to identify the area of concern, select a species or community type, and make on-the-fly charts and figures of CLs and relative risks and uncertainties at current deposition levels

US EPA Critical Loads Mapper (in development)Archives the most recent deposition and critical loads estimates and allows user to map exceedances for any management unit or critical load

Slide56

Why do we care? – original version of slide

Changes vegetation patternsDecreases biodiversityCan increase rates of change from shifting climate

Reduces quality of the visitor experience

Slide57

Ecological Impacts of N deposition

LandscapeSynergistic effects of Climate Change / Development / Fire / Invasive Grasses (Rao et al. 2010,

Talluto and

Suding 2008)

Urbanization

Exotic SpeciesFire

Nitrogen Deposition

Slide58

Slide59

Critical Load and Exceedance Maps

Slide60

Critical Load and Exceedance Maps

Slide61

Critical Load and Exceedance Maps

Slide62