/
Purpose:  Investigate upstream antecedent atmospheric conditions associated with massive Purpose:  Investigate upstream antecedent atmospheric conditions associated with massive

Purpose: Investigate upstream antecedent atmospheric conditions associated with massive - PowerPoint Presentation

bigboybikers
bigboybikers . @bigboybikers
Follow
343 views
Uploaded On 2020-08-05

Purpose: Investigate upstream antecedent atmospheric conditions associated with massive - PPT Presentation

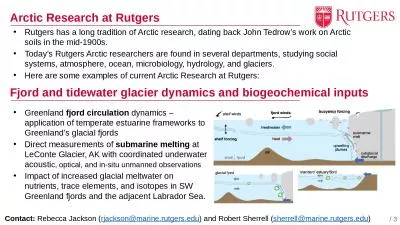
Data CFSR gridded analyses at 05 resolution Saha et al 2010 LargeScale MidlatitudePolar Flow Interactions Leading to Rapid Surface Ice Melt over Greenland and Sea Ice Volume Loss over the Arctic Ocean in June 2019 ID: 799182

2019 june utc 0000 june 2019 0000 utc hpa dam geopotential height wind greenland 500 figure shaded figs northeast

Share:

Link:

Embed:

Download Presentation from below link

Download The PPT/PDF document "Purpose: Investigate upstream anteceden..." is the property of its rightful owner. Permission is granted to download and print the materials on this web site for personal, non-commercial use only, and to display it on your personal computer provided you do not modify the materials and that you retain all copyright notices contained in the materials. By downloading content from our website, you accept the terms of this agreement.


Presentation Transcript

Slide1

Purpose:

Investigate upstream antecedent atmospheric conditions associated with massive Greenland surface ice melt event of June 2019.Data: CFSR gridded analyses at 0.5° resolution (Saha et al. 2010).

Large-Scale Midlatitude–Polar Flow Interactions Leading to Rapid Surface Ice Meltover Greenland and Sea Ice Volume Loss over the Arctic Ocean in June 2019

Lance F. Bosart

*, Kevin A. Biernat, and Daniel Keyser

University at Albany, SUNYDepartment of Atmospheric and Environmental Sciences

2

) Negative NAO

Background

: Massive Greenland surface ice melt event occurred in June 2019.

1) Background, Purpose, and Data

3

) Upstream North Pacific Flow Evolution

Poster number: 628

This research was supported by

Office of Naval Research Grant N00014-18-1-2200

Reference and Acknowledgment

Presented at 100th AMS Annual Meeting on 14 January 2020

*

E-mail:

lbosart@albany.edu

8

) Discussion

Figure

2. (a) NAO index from Climate Prediction Center, and (b) 26 April–23 June 2019 time-mean 300-hPa geopotential height (dam, black) and time-mean standardized anomalies of 300-hPa geopotential height (σ, shaded).

The massive Greenland surface ice melt event of June 2019 (Fig. 1) occurs during a persistent negative NAO regime that began in late April (Fig. 2).The melt event is linked to a Tibetan Plateau “heat burst” that triggers NPAC Rossby wave breaking, which subsequently leads to EPAC ridging, a CA tropical moisture surge, and a deepening progressive western North American trough (Figs. 3a–h).The progressive western North American trough eventually interacts with a trough over the MS Valley, and the trough interaction produces a strong moist southerly flow that allows deep tropical moisture to reach northeast Canada (Figs. 4a–h). Strong ridging occurs over northeast Canada ahead of a now negatively tilted trough over the Great Lakes lifting to the northeast, and strong ridging occurs over northeast Greenland to the northeast of a cutoff cyclone that forms to the northeast of Labrador (Figs. 5a–h).Both ridging events are associated with the transport of deep tropical moisture toward the Arctic (Figs. 5a–h; Figs. 7a,b).Negative PV advection by the nondivergent and irrotational winds contributes to building the Canada and Greenland ridges (Figs. 6a–d).Greenland ridge 500-hPa geopotential height, 1000–500-hPa thickness, and 850-hPa temperature values reach 588 dam, 566 dam, and 15°C, respectively (Figs. 8a,b), and a deep layer of above-freezing temperatures extends from the surface to near 600 hPa (Fig. 8c).

Figure 1.

Greenland melt extent (%) during 2019. Source: NSIDC/Thomas Mote, University of Georgia; http://nsidc.org/greenland-today/.

Saha

, S., and Coauthors, 2010: The NCEP Climate Forecast System Reanalysis.

Bull. Amer. Meteor. Soc., 91, 1015–1057.Special thanks to Alicia Bentley for scripts to generate CFSR analyses.

4) North America Flow Evolution

5) Northeast Canada and Greenland Ridging

276

288

300

312

324

336

348

360

372

384

264

K

20

25

30

35

40

45

50

55

60

65

70

mm

6

8

10

12

16

20

24

28

10

−5

s

−1

−6

−5

−4

−3

−2.5

−2

−1.5

−1

−0.5

0

0.5

1

1.5

2

2.5

3

4

5

6

σ

6

8

10

12

16

20

24

28

10

−5

s

−1

−6

−5

−4

−3

−2.5

−2

−1.5

−1

−0.5

0

0.5

1

1.5

2

2.5

3

4

5

6

σ

Figure 3

. (left) DT (2-PVU surface) θ (K, shaded)

and wind (

kt

, flags and barbs), and 925–850-hPa ζ (10

−5

s−1); (right) 700-hPa geopotential height (dam, black), temperature (K, red), and wind (kt, flags and barbs), and PW (mm, shaded).

Figure 4. (left) 500-hPa ζ (10−5 s−1, shaded), geopotential height (dam, black), temperature (K, red), ascent (5 × 10⁻³ hPa s−1, blue), and wind (kt, flags and barbs); (right) 700-hPa geopotential height (dam, black) and wind (kt, flags and barbs), and standardized anomalies of PW (σ, shaded).

Figure 5. (left) 500-hPa ζ (10−5 s−1, shaded), geopotential height (dam, black), temperature (K, red), ascent (5 × 10⁻³ hPa s−1, blue), and wind (kt, flags and barbs); (right) 700-hPa geopotential height (dam, black) and wind (kt, flags and barbs), and standardized anomalies of PW (σ, shaded).

7) Trajectories, Time Series, and Sounding

6

) Potential Vorticity (PV) Advection

−15

−13

−11

−9

−7

−5

−3

−1

0

1

3

5

7

9

11

13

15

PVU

day

−1

Figure 6

. (left) 300–200-hPa PV (PVU, gray), nondivergent wind (m s−1, vectors), and PV advection by nondivergent wind (PVU day−1, shaded), and 600–400-hPa ascent (5 × 10⁻³ hPa s−1, red); (right) As in (left), but for irrotational wind.

Figure

7

. (a) Forward trajectories starting at 0000 UTC 2 June and (b) backward trajectories ending at 0000 UTC 13 June. Source: NOAA HYSPLIT.

Figure 8. (a) Time series of (a) 500-hPa geopotential height (dam) and 1000–500-hPa thickness (dam), and (b) 850-hPa temperature (K) and wind (kt), for yellow star location in (d). (c) 0000 UTC 13 June 2019 sounding for Ittoqqortoormitt, Greenland [red star location in (d)] (source: University of Wyoming). (d) 500-hPa geopotential height (dam) at 0000 UTC 13 June 2019.

10

11

12

13

14

15

16

17

Day in June 2019 labeled at 0000 UTC

530

540

550

560

570

580

590

10

11

12

13

14

15

16

17

Day in June 2019 labeled at 0000 UTC

2

4

6

8

10

12

14

16

500-hPa geopotential

height

(dam)

1000–500-hPa

thickness

(dam)

850-hPa temperature (K)

850-hPa

wind

(

kt

)

(a) 0000 UTC 3 June 2019

(b) 0000 UTC 3 June 2019

(c) 0000 UTC 5 June 2019

(d) 0000 UTC 5 June 2019

(e) 0000 UTC

7

June 2019

(f) 0000 UTC

7

June 2019

(g) 0000 UTC 9 June 2019

(h) 0000 UTC

9

June 2019

(a) 0000 UTC 3 June 2019

(b) 0000 UTC 3 June 2019

(c) 0000 UTC 5 June 2019

(d) 0000 UTC 5 June 2019

(e) 0000 UTC

7

June 2019

(f) 0000 UTC

7

June 2019

(g) 0000 UTC 9 June 2019

(h) 0000 UTC

9

June 2019

(c) 0000 UTC 11 June 2019

(d) 0000 UTC 11 June 2019

(a) 0000 UTC 10 June 2019

(b) 0000 UTC 10 June 2019

(e) 0000 UTC 12 June 2019

(f) 0000 UTC 12 June 2019

(g) 0000 UTC 13 June 2019

(h) 0000 UTC 13 June 2019

(c) 0000 UTC 11 June 2019

(d) 0000 UTC 11 June 2019

(a) 0000 UTC 9 June 2019

(b) 0000 UTC

9

June 2019

3

2.5

2

1.5

1.25

1

0.75

0.5

0

.25

0

−0.25

−0.5

−0.75

−1

−1.25

−1.5

−2

−2.5

−3

(a)

(b)

(a)

(b)

(a)

(b)

(c)

(d)