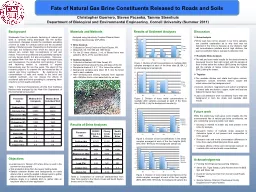
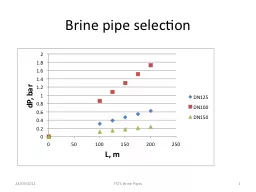
DEIR Monterey Desal Project DRAFT Presentation to Monterey Peninsula Regional Water Authority 23 June 2015 Outline Brine Disposal System Overview Critical Issues Near Field Approach SemiEmpirical Analysis ID: 779986
Download The PPT/PDF document "Review of Brine Disposal System" is the property of its rightful owner. Permission is granted to download and print the materials on this web site for personal, non-commercial use only, and to display it on your personal computer provided you do not modify the materials and that you retain all copyright notices contained in the materials. By downloading content from our website, you accept the terms of this agreement.
Slide1
Review of Brine Disposal System
DEIR, Monterey
Desal
Project
DRAFT
Presentation to Monterey Peninsula Regional Water Authority
23 June 2015
Slide2Outline
Brine Disposal System Overview
Critical Issues
Near Field Approach
Semi-Empirical Analysis
Conservative assumptions
Potential weaknesses
Far Field Approach
Conservative assumptions
Potential weaknesses
Results and Mitigation
Conclusions
Recommendations
Slide3Brine Disposal System
3
Monterey Regional
Water Pollution
Control Agency’s (MRWPCA) ocean outfall and
diffuser (existing)Diffuser1,100 ft long90 – 110 ft deep172 ports total130 ports open8 ft port spacingAlternating sidesHorizontal discharge3.5 to 4 ft above sea floor
Source: Appendix D2
16
ft
Slide4Brine Disposal System
4
Buoyancy
Wastewater floats
High dilution
Brine sinksLower dilutionBlend can do either
wastewater
brine
Source: modified from Appendix D2
Slide5Discharge Composition
5
Source: Modified from Appendix D4
Slide6Terminology
6
Source:
Abessi
& Roberts (2014)
Near Field Far
Field
Source: Jenkins
and Wasyl (2009).Dominated by jets
Short time and length scales
Seconds to minutes
Feet to tens of feet
Dominated by ocean processes
Long time and length scales
Hours to days
Hundreds of feet to miles
Slide7Critical Issues
Near Field (mixing due to jet/plume velocity/buoyancy)
Achieving targets at edge of “brine mixing zone” (defined as the lesser of the zone of initial dilution (ZID) and 100 m)
Change in salinity < 2.0
ppt
(SWRCB March 2015 recommendation)Concentrations for numerous constituents as per 2012 California Ocean PlanEdge of ZID governs (ZID within 100 m)Critical case is when plume sinks7
Slide8Critical Issues
Far Field (mixing due to ambient ocean currents)
Hypoxic: low dissolved oxygen concentration
Density currents
Pooling due to bathymetry
8May 5, 2015 Draft Final Desalination Amendment to the Ocean Plan
Slide9Near Field Approach
Rising
positively-buoyant
plume
When volume of blended wastewater is large enough plume will rise
Analyzed using Visual Plumes (VP)Well accepted for rising (buoyant) plumesUsed appropriate ambient salinity and temperature conditionsAssumed zero ambient cross-flow (conservative assumption)Large dilution (≥ 68) at edge of ZID is achievedSalinity and Ocean Plan objectives easily met9
Slide10Near Field Approach
Sinking negatively-buoyant plume
Considered two approaches:
Visual Plumes (VP)
VP is well-validated for rising plumes
Less validation for sinking plumes (especially for horizontal discharge)Compelling evidence that dilution from VP is substantially under-estimated for negatively-buoyant discharges (Palomar et al., 2012)CORMIX, CORJET, and JetLag also substantially underestimateDilution results from VP were not usedSemi-empirical analysisBased on analysis by Kikkert et al., (2007) and Fischer et al., (1979)Approach is reasonable … 10
Slide11Semi-Empirical Analysis (Near Field)
Plume trajectory based
on
analysis
by
Kikkert et al. (2007)Well validated by experimentsDilution based upon analysisfor non-buoyant jet (Fischer etal., 1979) using plume lengthcalculated along trajectoryFischer approach is reasonable due to flat trajectory [vertical distance (3.5 feet) << horizontal distance (~12 feet)] i.e., jet behavior dominates in this region
11
~12
ft3.5
ft
Slide12Semi-Empirical Analysis (Near
Field)
C
onservative assumptions
Dilution calculation assumed
round jet, whereas jet is oval shapedOval shape has higher area to volume ratio and will achieve more dilution than circular shapeAssumed minimum height above sea-floor of 3.5 feet (only 19 ports have height of 3.5 feet, most ports have height nearer to 4 feet)Larger height will allow for longer travel distance and more dilution12
Slide13Semi-Empirical Analysis (Near
Field)
C
onservative assumptions
The dilution at the impact point was used in the analysis. However, the near-field continues beyond the impact point (the flow and mixing are still dominated by jet processes) and additional dilution will occur within the near field (i.e., the ZID is larger than assumed)
“the increase in dilutionfrom the impact point tothe end of the near fieldis approximately 60% for nonmerged jets” (inclined jets, Abessi & Roberts, 2014)13
Slide14Semi-Empirical Analysis (Near
Field)
Potential Weaknesses
Analysis used in DEIR to assess merging of jets is ad-hoc
Volume of water entrained in 10 seconds was compared to volume of water available per port
Merging of jets will reduce dilutionRecommend replacing analysis in EIR with improved Port Spacing Analysis by Geosyntec (provided on Slide 16)Coanda effect is not addressed in DEIRCoanda effect is the tendency for a jet to deviate towards and attach to near surfaces (in this case the sea-floor)Coanda attachment would reduce dilutionRecommend including new Coanda Analysis by Geosyntec in EIR (provided on Slide
17)
14
Slide15Semi-Empirical Analysis (Near
Field)
Potential Weaknesses
Existing ports are horizontal which is not optimal for negatively-buoyant discharges
Consider retrofit with inclined ports if additional dilution is required
15
Slide16Port Spacing Analysis
Based on experiments
Abessi
& Roberts (2014) recommend the following to avoid merging of jets;
s >~2.d.F
where s = spacing, d = port diameter, and F = densimetric Froude numberd = 1.86 inches (Appendix D2, Table 3)F ≈ 26 (Appendix D1, Table 5)→ s > ~ 8 ftPort spacing on diffuser is 16 ft (alternating sides)Jets will not mergeSame conclusion as in DEIR, but this analysis is more robust16
Slide17Coanda
Analysis
Based on experiments Shao & Law (2011) recommend the following minimum clearance above the sea-floor to prevent
Coanda
attachment;
z0 > 0.12 (π/4)0.25 d.F = 0.11 d.Fwhere, d = port diameter, and F = densimetric Froude numberd = 1.86 inches (Appendix D2, Table 3)F ≈ 26 (Appendix D1, Table 5)→ z0 > ~ 0.5 ft
Ports are 3.5 ft above sea-floor
Coanda attachment will not occurInclude this analysis in EIR
17
Slide18Far Field Approach
Uses regional ocean model (ROM) to extract time-series of horizontal velocities (u and v) at diffuser location
Examines different seasonal patterns
Oceanic, Davidson, Upwelling
Assumes the velocity field (
u,v) is spatially homogeneousGenerally conservative assumptionNeglects local variations in bathymetryBathymetry in vicinity of brine plume is generally flat (no depressions or ridges) and sloping to seaBrine plume does not extend to Monterey CanyonDiffuser structure may act as a ridge to trap brine locallySolves 2-D advection-diffusion18
Slide19Far Field Approach
Conservative assumptions
Neglects vertical mixing
Mixing and dilution underestimated away from the diffuser
Stability was examined via computing Richardson number
Uses low-end lateral diffusion coefficient1.37 m2/s (versus 2 m2/s measured by Ledwell et al., (1998))Neglects wave actionWaves provide additional mixingNeglects gravity currentGravity current would tend to move brine away from diffuser more quickly (down-slope)19
Slide20Far Field Potential Weaknesses
Present analysis is “dated”
Modern approach would use full 3D model including density effects and spatially varying velocity field
However, present analysis is generally conservative
3D model will likely result in additional dilution
Neglects gravity currentsUnlikely to affect conclusions, since bathymetry is generally flat in vicinity of diffuserBrine plume does not reach Monterey Canyon20
Appendix D1, page 8
Slide21Far Field Potential Weaknesses
Brine particles are only tracked for 48 hours
Simulation period is 90 days
What happens to particle after 48 hours?
If particle simply disappears then will the extent of the plume be underestimated?
Unlikely to affect conclusions, since exceedances are governed by near field21
Slide22Far Field Potential Weaknesses
Local trapping of brine by diffuser structure was not fully addressed
Trapping is minimized by aligning diffuser structure with slope (perpendicular to shore)
Recommend adding discussion of this issue considering current directions (from ROM) with respect to diffuser alignment and tidal reversals
Potential for hypoxia was not addressed
Recommend including Hypoxia Analysis by Geosyntec in EIR (provided on Slides 23-25)22
Slide23Hypoxia Analysis
Potential for hypoxia can be addressed using simple mass balance approach;
Estimate oxygen demand from sediments
Estimate oxygen supplied by brine plume (including entrained flow)
23
Sediment oxygen demand
Entrainment of dissolved oxygen
Slide24Hypoxia Analysis
Sediment oxygen demand (SOD) in Monterey Bay
5.0 to 13.5
mmol
/m
2/day (Berelson et al., 2003)0.16 to 0.43 g/m2/dayAreal extent of plume~3,000 ft x 1,500 ft = 4,500,000 ft2~420,000 m2Mass flux consumed;70 to 180 kg/day24
Figure 4.3-5
Slide25Hypoxia Analysis
Brine flow rate = 13.98 MGD
Dilution > 15
Entrained flow > 15 x 13.98 = 210 MGD = 9.2 m
3
/sAmbient dissolved oxygen concentration > 7 mg/Llower limit of Ocean PlanMass flux supplied;> 5,600 kg/dayOxygen supplied by entrained flow > 30 times greater than oxygen consumed by sedimentsHypoxia unlikely25
Slide26Results and Monitoring
Results of analyses indicate some exceedances of Ocean Plan criteria at edge of ZID are possible for certain constituents;
Copper,
Ammonia
, Chlordane, DDT,
PCBs, TCDD Equivalents, ToxapheneDepends upon Project versus Variant and on flow blendsMonitoring program may indicate no exceedancesMany conservative assumptions in analysisDrawing source water through sand/sediments will likely remove some PCBsWill this cause a build up of PCBs in sediments?26
Slide27Mitigation Measures
Proposed Mitigation Measure 4.3-4
Additional pre-treatment of source water
Treatment of discharge
Temporary storage and release of brine
3 million gallon brine storage basinStore 5 to 8 hours of flowCan pulsing achieve necessary dilutions?Recommend conducting additional near-field analysis to demonstrate (if necessary)Consider retrofit of diffuser to add inclined ports60o – 65o is optimal for negatively-buoyantNeed to also consider buoyant cases (trade-off)27
Slide28Brine Disposal System - Conclusions
Brine disposal governed by near field
C
oncentrations at ZID
DEIR used two methodologies for near field
Visual Plumes for rising dischargesSemi-empirical analyses for sinking dischargesTrajectory for sinking plume from Kikkert et al., (2007)Dilution for sinking plume estimated using method for non-buoyant jet (Fischer et al., 1979)28
Slide29Brine Disposal System - Conclusions
Near
field analyses
make
reasonable and conservative
assumptionsRound jets (instead of oval)Minimum height of port above sea-floor of 3.5 feetZID defined as jet impact point and not end of near field29
Slide30Brine Disposal System - Conclusions
Near
field analysis of merging jets was
ad-hoc
New analysis by
Geosyntec indicates jets will not mergeNear field analysis of Coanda attachment was not includedAnalysis by Geosyntec indicates Coanda attachment will not occurNear field analysis was not performed to demonstrate extent of increased dilution due to pulsingMitigation measure 4.3-430
Slide31Brine Disposal System - Conclusions
F
ar field analyses makes conservative assumptions
No vertical mixing of brine
Low-end estimate for horizontal diffusivity
Neglects wave actionNo density current*Far field method is “dated”3D simulations including density currents could be used3D simulations would likely result in more dilutionFlat bathymetry in the vicinity of the diffuser and conservative assumptions31
Slide32Brine Disposal System - Conclusions
Potential for hypoxia not discussed
Analysis by
Geosyntec
indicates
hypoxia is unlikelyBrine trapping by diffuser structure not analyzedMinimized by aligning diffuser structure with slope (perpendicular to shore)Brine particles are only tracked for 48 hoursWhat happens to particle after 48 hours?32
Slide33Brine Disposal System - Recommendations
Include the following analyses provided by
Geosyntec
Port merging
Coanda
effectHypoxiaAddress/discuss potential for build up of PCBs in sediments surrounding intakesConduct additional near field analysis to estimate additional dilution achievable by pulsing brine dischargeConsider retrofit of diffuser ports with inclined angles to achieve more dilution if necessary33
Slide34Brine Disposal System - Recommendations
Add discussion
of
potential for diffuser structure to trap brine
Consider current
directions (from ROM) and bathymetry slope with respect to diffuser alignment and tidal reversalsConsider using 3D far field modelWill likely result in additional dilutionWill better address potential for brine trapping by diffuser structureAdd discussion of the effect of only tracking brine particles for 48 hours34
Slide35Recommended Minor Edits
35
Issue
Description
Page
Comments / RecommendationsIncorrect interpretation of SWRCB 2012aSWRCB 2012a states that increase in salinity should be limited to < 5% of background, corresponding to 1.7 ppt in California waters. The DEIR then rounds this to 2.0 ppt
, but this is an incorrect interpretation of the 2012 document (i.e., it should be 1.7 ppt).
4.3-27The phrase, “(rounded to 2.0
ppt)” should be removed from the EIR. Note that SWRCB 2015 refers directly to 2.0 ppt (it does not refer to 5% or 1.7 ppt). That is, 2.0 ppt is the correct target per SWRCB 2015, but not per SCWRCB 2012a.
Different number of ports
The
correct number of
open ports (130) is first mentioned in Section
4.3. This is late in the report to mention the change (from 120) and surprises the reader.
4.3-72
The incorrect number of ports should be mentioned earlier in the EIR, including in the Executive Summary. It should also be re-iterated that using 130 instead of 120 provides additional dilution (as demonstrated in Addendum to Appendix D4).
Misleading statement overstates the extent of the plumeThe DEIR states, “where the plume extended from near the Monterey Submarine Canyon rim to the center of the southern half of Monterey Bay”. This statement overstates the extent of the plume, and is perhaps mistakenly based on the inset figure.4.3-88Revise wording to better indicate that the plume extent is several miles from the Monterey Submarine Canyon rim.
Slide36Recommended Minor Edits
36
Issue
Description
Page
Comments / RecommendationsUnnecessary footnote in tableSee Comments / RecommendationsTable 4.3-11
Footnote ‘a’
should be removed and the column header changed from “Average Dilution” to “Centerline Dilution”.
Equation for centerline dilution not providedEquation (7) presented in Appendix D2 is for average dilution, whereas calculations provide centerline dilution (which is ~1.4 times lower (Fischer et al., 1979)). App D2,pages 10 and C-13
EIR should be modified to include the relation between average and centerline dilution.
Apparent discrepancy in port and duckbill size
4 inch duckbill valves are specified, but the port size is given as 2 inch.
App D2
This discrepancy should be corrected or explained.
Slide37References
Abessi
& Roberts (
2014), Multiport Diffusers for Dense Discharges,
J. Hydraul. Eng. 04014032-1.Berelson, McManus, Coale, Johnson, Burdige, Kilgore, Colodner, Chavez,
Kuleda, Boucher (2003), A time series of benthic flux measurements from Monterey Bay, CA,
Continental Shelf Research 23 (2003) 457-481.Fischer, List,
Koh, Imberger, Brooks (1979), “Mixing in Inland and Coastal Waters”, Academic Press
Jenkins
&
Wasyl
(2009), Current Analysis for Receiving Water of the Santa
Cruz Seawater
Desalination Project, submitted to City of Santa Cruz, 49 pp + app.
Kikkert, Davidson, Nokes (2007), Inclined Negatively Buoyant Discharges, J. Hydraul. Eng. 2007.133:545-554.Ledwell, Watson, Law, Law, (1998), Mixing of a tracer in the pycnocline, Journal of Geophysical Research, 103(C10), 21499-21529.Palomar, Lara, Losada (2012), Near field brine discharge modeling part 2: Validation of commercial tools, Desalination 290 (2012) 28-42.Shao & Law (2011
), Boundary impingement and attachment of horizontal offset dense jets, Journal of Hydro-environment Research 5 (2011) 15-24.37