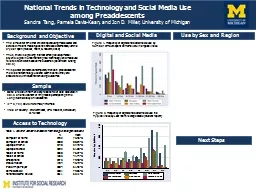
/
National Trends in Technology and Social Media Use National Trends in Technology and Social Media Use

National Trends in Technology and Social Media Use - PowerPoint Presentation

bikerssurebig
bikerssurebig . @bikerssurebig
Follow
343 views
Uploaded On 2020-06-22

National Trends in Technology and Social Media Use - PPT Presentation

among Preadolescents Sandra Tang Pamela DavisKean and Jon D Miller University of Michigan Background and Objective Digital and Social Media Internet Use by Sex and Region Sample Access to Technology ID: 782601

social media technology digital media social digital technology sex figure internet trends 2015 region purpose 2010 school children

Share:

Link:

Embed:

Download Presentation from below link

Download The PPT/PDF document "National Trends in Technology and Social..." is the property of its rightful owner. Permission is granted to download and print the materials on this web site for personal, non-commercial use only, and to display it on your personal computer provided you do not modify the materials and that you retain all copyright notices contained in the materials. By downloading content from our website, you accept the terms of this agreement.


Presentation Transcript

Slide1

National Trends in Technology and Social Media Use

among PreadolescentsSandra Tang, Pamela Davis-Kean, and Jon D. Miller, University of Michigan

Background and Objective

Digital and Social Media

Internet Use by Sex and Region

Sample

Access to Technology

The amount of time that children spend using media overall and across different media types has increased dramatically within a 5-year span (

Rideout

,

Foehr

, & Roberts, 2010)

Thus, there is a growing interest among developmental psychologists in understanding how technology and media use relates to children’s academic outcomes (Davis-Kean & Tang, 2015)

Prior trends indicate that preadolescents engage in some of the highest amounts of media consumption (

Rideout et al., 2010)This poster presents contemporary trends in preadolescents’ media and technology use and examines how they are associated with students’ schooling outcomes

Data are drawn from an early release file of data collected in 2015 on a new cohort of 7th graders participating in the Longitudinal Study of Adolescents (LSAY)N = 3,721; Sex: 51% female, 49% male; Area of Country: 6% Northeast, 37% Midwest, 36% South, 21% West

Figure 1. Frequency of Digital and Social Media Use by Number of Hours Spent on Homework in a Typical Week

Figure 2. Frequency of Digital and Social Media Use in a Typical Week by This Year’s Average Grade (student report)

Results and Next Steps

The most common technologies accessible to 7th graders in 2015 were computers at school (80.84%), smartphones (79.9%), and game consoles (79.06%)

In general, students who use digital and social media more frequently report spending less time on homework and have lower school grades. Also, students with lower than a ‘C’ engage in less interactive media and more solo media. Internet use is primarily motivated by accessing social media, and there appear to be no differences by sex or region except sex differences in looking up sports information. Future analyses will examine digital and media use by extracurricular activities, and compare child with parent reports of their own and children’s use of technology, and digital and social media.

Figure 3.

Purpose for Using the Internet by Sex

Figure 4.

Purpose for Using the Internet by Region of the Country

*

p

< .05