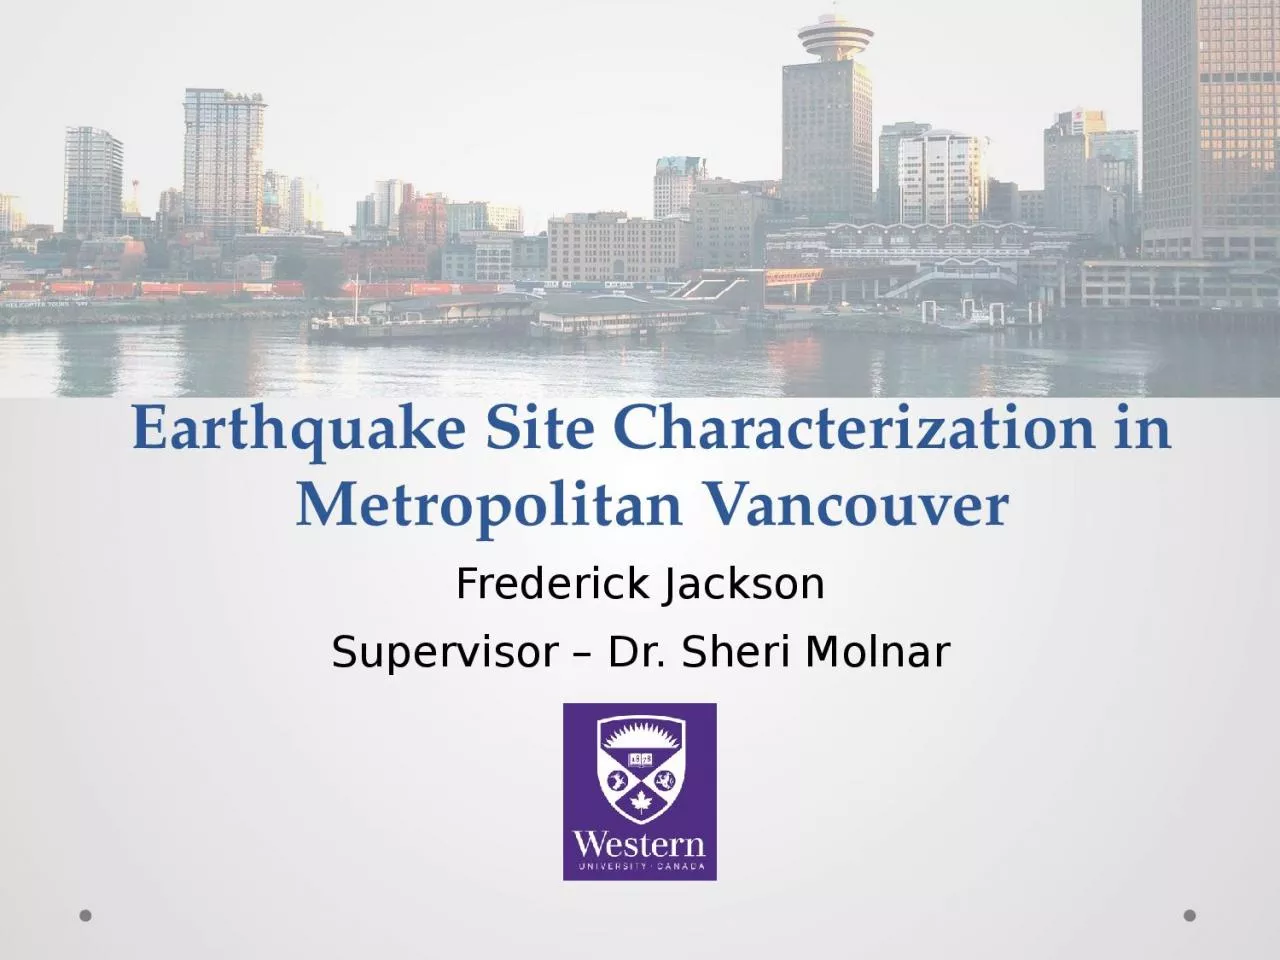
/
Earthquake Site Characterization in Metropolitan Vancouver Earthquake Site Characterization in Metropolitan Vancouver

Earthquake Site Characterization in Metropolitan Vancouver - PowerPoint Presentation

bitsy
bitsy . @bitsy
Follow
68 views
Uploaded On 2023-11-23

Earthquake Site Characterization in Metropolitan Vancouver - PPT Presentation

Frederick Jackson Supervisor Dr Sheri Molnar 2 Population gt 2 million and critical infrastructure Hazard 3 types of earthquakes sedimentary basin What will ground shaking be like during a future large earthquake ID: 1034579

seismic earthquake velocity site earthquake seismic site velocity metropolitan vancouver ground hazard estimates shear spectral wave ratio school soil

Share:

Link:

Embed:

Download Presentation from below link

Download Presentation The PPT/PDF document "Earthquake Site Characterization in Metr..." is the property of its rightful owner. Permission is granted to download and print the materials on this web site for personal, non-commercial use only, and to display it on your personal computer provided you do not modify the materials and that you retain all copyright notices contained in the materials. By downloading content from our website, you accept the terms of this agreement.


Presentation Transcript

1. Earthquake Site Characterization in Metropolitan VancouverFrederick JacksonSupervisor – Dr. Sheri Molnar

2. 2Population > 2 million and critical infrastructureHazard 3 types of earthquakessedimentary basin What will ground shaking be like during a future large earthquake? Georgia basinGreater Vancouver is area of highest seismic risk in Canada

3. Earthquake Ground ShakingDepends on: Earthquake source (mechanism) and depthMaterial properties along travel pathSite conditionsGround surface shaking is strongly affected by waves travelling through upper few kilometers (or less)Earthquake damage related to “soft” soils (i.e. low shear-wave velocity material)1964 Alaska, 1985 Mexico City, 1989 Loma Prieta, 1994 Northridge, 1995 Kobe Sedimentary basin (3D structure)Soil profile(1D structure)

4. Application of Seismic Microzonation MapsExample from 1989 Loma Prieta Earthquake in California: Areas of greater hazard identified on maps as early as 1975Source uncertain

5. Seismic Soil Hazard Mapping: Work done to date in the Lower MainlandSoil hazard (amplification) map of Lower Mainland prepared for BC School Retrofit program by UBCMonahan, 2005Regional map based on surficial geology, limited borehole data, and regional shear-wave velocity model

6. Project AimsAdd to the database of knowledge on seismic velocities in Metropolitan Vancouver as part of seismic microzonation mapping project of the regionImproved site classification and hazard assessment

7. ObjectivesUpdate and assess earthquake site response in Metropolitan Vancouver Earthquake recordings from December 2015 M4.7 Victoria earthquakePerform site characterization at ~15 “new” locations in Metropolitan Vancouver School sites in Metropolitan Vancouver: (1) BC School Seismic Retrofit program, (2) UBC-RCAV Earthquake Early Warning System

8. 1. Ground motion from the December 2015 Earthquake (M4.7)Assess whether ground motions amplified by local geologyFor example, amplitudes (PGA) should reduce with distance but ‘pockets’ of anomalous amplitudeAmplification depends on:Thickness and elastic properties of the upper soil layers (>1km)Seismic impedence ratioM=4.7Strait of GeorgiaGreater Vancouver VictoriaBritish ColumbiaVancouver Island

9. 2. Site CharacterizationPredict how earthquake ground motions may be altered by underlying geology (amplitude, frequency, duration) a) Spectral Ratio MethodsEarthquake and microtremor horizontal-to-vertical spectral ratios Provide estimates of site period or peak frequencyb) Shear Velocity Depth ProfilingPassive seismic (microtremor) arraysProvide estimates of Vs30 (NBCC requirement)

10. a) Spectral Ratio MethodsSingle three-component sensorsCharacterise sites using the spectral ratio between horizontal and vertical components of motion (H/V)Ratios exhibit a maximum peak corresponding to the fundamental resonance frequency‘Growth’ of peaks towards surface = site amplificationFrequency

11. b) Array TechniquesMultiple sensors placed in a geometric arrayCan use the dispersive nature of Rayleigh waves to generate a dispersion curve This can be inverted to obtain a shear wave velocity profileFrequency (Hz)Frequency (Hz)Velocity (m/s)Velocity (m/s)

12. Impact of studyNon-invasive, rapid, and inexpensive earthquake site characterizationImproved estimates of shear wave velocity within Metropolitan Vancouver for use in:Assessment of amplification and liquefaction potentialSeismic design; building and bridge codesImproved hazard estimates  Improved risk (loss) estimates

13. Thank you for listening