/
2/8/19 1 Acoustics of Speech 2/8/19 1 Acoustics of Speech

2/8/19 1 Acoustics of Speech - PowerPoint Presentation

blanko
blanko . @blanko
Follow
65 views
Uploaded On 2023-11-08

2/8/19 1 Acoustics of Speech - PPT Presentation

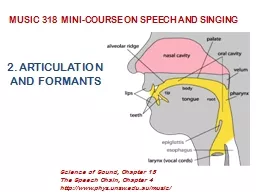
Julia Hirschberg and Sarah Ita Levitan CS 6998 2819 2 Goal 1 Distinguishing One Phoneme from Another Automatically ASR Did the caller say I want to fly to Newark or ID: 1030656

frequency speech cycle pitch speech frequency pitch cycle sampling signal amplitude pressure rate vocal air sound cycles voice sounds

Share:

Link:

Embed:

Download Presentation from below link

Download Presentation The PPT/PDF document "2/8/19 1 Acoustics of Speech" is the property of its rightful owner. Permission is granted to download and print the materials on this web site for personal, non-commercial use only, and to display it on your personal computer provided you do not modify the materials and that you retain all copyright notices contained in the materials. By downloading content from our website, you accept the terms of this agreement.


Presentation Transcript

1. 2/8/191Acoustics of SpeechJulia Hirschberg and Sarah Ita LevitanCS 6998

2. 2/8/192Goal 1: Distinguishing One Phoneme from Another, AutomaticallyASR: Did the caller say ‘I want to fly to Newark’ or ‘I want to fly to New York’?Forensic Linguistics: Did the accused say ‘Kill him’ or ‘Bill him’?What evidence is there in the speech signal?How accurately and reliably can we extract it?

3. 2/8/193Goal 2: Determining How things are said is sometimes critical to understandingIntonationForensic Linguistics: ‘Kill him!’ or ‘Kill him?’TTS: ‘Are you leaving tomorrow./?’What information do we need to extract from/generate in the speech signal? What tools do we have to do this?

4. 2/8/194Today and Next ClassHow do we define cues to segments and intonation?Fundamental frequency (pitch)Amplitude/energy (loudness)Spectral featuresTiming (pauses, rate)Voice QualityHow do we extract them?PraatopenSMILElibROSA

5. OutlineSound productionCapturing speech for analysisFeature extractionSpectrograms2/8/195

6. 2/8/196Sound ProductionPressure fluctuations in the air caused by a musical instrument, a car horn, a voice…Sound waves propagate thru e.g. air (marbles, stone-in-lake)Cause eardrum (tympanum) to vibrateAuditory system translates into neural impulsesBrain interprets as soundPlot sounds as change in air pressure over timeFrom a speech-centric point of view, sound not produced by the human voice is noiseRatio of speech-generated sound to other simultaneous sound: Signal-to-Noise ratio

7. Simple periodic waves2/8/197Characterized by frequency and amplitudeFrequency (f) – cycles per second Amplitude – maximum value in y axisPeriod (T) – time it takes for one cycle to complete

8. Speech sound waves2/8/198+ compression0 normal air pressure- rarefaction (decompression)

9. How do we capture speech for analysis?Recording conditionsQuiet office, sound booth, anechoic chamber 2/8/199

10. How do we capture speech for analysis?Recording conditionsMicrophones convert sounds into electrical current: oscillations of air pressure become oscillations of voltage in an electric circuitAnalog devices (e.g. tape recorders) store these as a continuous signalDigital devices (e.g. computers, DAT) first convert continuous signals into discrete signals (digitizing)2/8/1910

11. 2/8/1911SamplingSampling rate: how often do we need to sample?At least 2 samples per cycle to capture periodicity of a waveform component at a given frequency 100 Hz waveform needs 200 samples per secNyquist frequency: highest-frequency component captured with a given sampling rate (half the sampling rate) – e.g. 8K sampling rate (telephone speech) captures frequencies up to 4K

12. Sampling

13. 2/8/1913Sampling/storage tradeoffHuman hearing: ~20K top frequency Do we really need to store 40K samples per second of speech?Telephone speech: 300-4K Hz (8K sampling)But some speech sounds (e.g. fricatives, stops) have energy above 4K…44k (CD quality audio) vs.16-22K (usually good enough to study pitch, amplitude, duration, …)Golden Ears…

14. What your phone is not telling you2/8/1914High frequency samples

15. The Mosquito2/8/1915Listen (at your own risk)

16. 2/8/1916Sampling ErrorsAliasing: Signals frequency higher than the Nyquist frequencySolutions:Increase the sampling rateFilter out frequencies above half the sampling rate (anti-aliasing filter)

17. 2/8/1917QuantizationMeasuring the amplitude at sampling points: what resolution to choose?Integer representation8, 12 or 16 bits per sampleNoise due to quantization steps avoided by higher resolution -- but requires more storageHow many different amplitude levels do we need to distinguish?Choice depends on data and application (44K 16bit stereo requires ~10Mb storage)

18. 2/8/1918But clipping occurs when input volume (i.e. amplitude of signal) is greater than range that can be representedWatch for this when you are recording for TTS!SolutionsIncrease the resolutionDecrease the amplitude

19. Clipping

20. WAV formatMany formats, trade-offs in compression, qualitySox can be used to convert speech formats

21. FrequencyHow fast are the vocal folds vibrating?Vocal folds vibrate for voiced sounds, causing regular peaks in amplitudeF0 – Fundamental frequency of the waveform Pitch track – plot F0 over time2/8/1921

22. Estimating pitchFrequency = cycles per secondSimple approach: zero crossings2/8/1922

23. AutocorrelationIdea: figure out the period between successive cycles of the waveF0 = 1/period Where does one cycle end and another begin?Find the similarity between the signal and a shifted version of itselfPeriod is the chunk of the segment that matches best with the next chunk2/8/1923

24. ParametersWindow size (chunk size)Step sizeFrequency range2/8/1924

25. Microprosody effects of consonants (e.g. /v/)Creaky voice  no pitch trackErrors to watch for in reading pitch tracks:Halving: shortest lag calculated is too long  estimated cycle too long, too few cycles per sec (underestimate pitch) Doubling: shortest lag too short and second half of cycle similar to first  cycle too short, too many cycles per sec (overestimate pitch)

26. Pitch Halvingpitch is halved

27. Pitch Doublingpitch is doubled

28. Pitch track

29. Pitch vs. F0Pitch is the perceptual correlate of F0Relationship between pitch and F0 is not linear;human pitch perception is most accurate between 100Hz and 1000Hz. Mel scaleFrequency in mels = 1127 ln (1 + f/700)

30. Mel-scaleHuman hearing is not equally sensitive to all frequency bandsLess sensitive at higher frequencies, roughly > 1000 HzI.e. human perception of frequency is non-linear:

31. AmplitudeMaximum value on y axis of a waveformAmount of air pressure variation: + compression, 0 normal, - rarefaction2/8/1931

32. IntensityPerceived as loudnessMeasured in decibels (dB)P0 = auditory threshold pressure = 2/8/1932

33. Plot of Intensity

34. 2/8/1934How ‘Loud’ are Common Sounds – How Much Pressure Generated?Event Pressure (Pa) DbAbsolute 20 0 Whisper 200 20Quiet office 2K 40Conversation 20K 60Bus 200K 80Subway 2M 100Thunder 20M 120*DAMAGE* 200M 140

35. 2/8/1935

36. 2/8/1936

37. Voice qualityJitterShimmerHNR2/8/1937

38. Voice qualityJitterrandom cycle-to-cycle variability in F0Pitch perturbationShimmerrandom cycle-to-cycle variability in amplitudeAmplitude perturbation2/8/1938

39. Jitterhttps://homepages.wmich.edu/~hillenbr/501.html

40. Shimmerhttps://homepages.wmich.edu/~hillenbr/501.html

41. Synthetic Continuum Varying in Jitter 0.0% 2.0% 0.2% 2.5% 0.4% 3.0% 0.6% 4.0% 0.8% 5.0% 1.0% 6.0% 1.5%https://homepages.wmich.edu/~hillenbr/501.html

42. Synthetic Continuum Varying in Shimmer 0.00 dB 1.60 dB 0.20 dB 1.80 dB 0.40 dB 2.00 dB 0.60 dB 2.25 dB 0.80 dB 2.50 dB 1.00 dB 2.75 dB 1.20 dB 3.00 dB 1.40 dBhttps://homepages.wmich.edu/~hillenbr/501.html

43. HNRHarmonics to Noise RatioRatio between periodic and aperiodic components of a voiced speech segmentPeriodic: vocal fold vibrationNon-periodic: glottal noiseLower HNR -> more noise in signal, perceived as hoarseness, breathiness, roughness2/8/1943

44. Reading waveforms2/8/1944

45. Fricative2/8/1945

46. SpectrumRepresentation of the different frequency components of a waveComputed by a Fourier transformLinear Predictive Coding (LPC) spectrum – smoothed version2/8/1946

47. Part of [ae] waveform from “had”2/8/1947Complex wave repeated 10 times (~234 Hz)Smaller waves repeated 4 times per large (~936 Hz)Two tiny waves on the peak of 936 Hz waves (~1872 Hz)

48. SpectrumRepresents frequency componentsComputed by Fourier transformPeaks at 930 Hz, 1860 Hz, and 3020 Hz2/8/1948

49. Spectrogram2/8/1949

50. Spectrogram2/8/1950

51. Source-filter modelWhy do different vowels have different spectral signatures?Source = glottisFilter = vocal tractWhen we produce vowels, we change the shape of the vocal tract cavity by placing articulators in particular positions2/8/1951

52. Reading spectrograms2/8/1952

53. Mystery Spectrogram2/8/1953

54. MFCCSounds that we generate are filtered by the shape of the vocal tract (tongue, teeth etc.)If we can determine the shape, we can identify the phoneme being producedMel Frequency Cepstral Coefficients are widely used features in speech recognition2/8/1954

55. MFCC calculationFrame the signal into short framesTake the Fourier transform of the signalApply mel filterbank to power spectra, sum energy in each filterTake the log of all filterbank energiesTake the DCT of the log filterbank energiesKeep DCT coefficients 2-132/8/1955

56. Next classDownload Praat from the link on the course syllabus pageRead the Praat tutorial linked from the syllabusBring a laptop and headphones to class2/8/1956