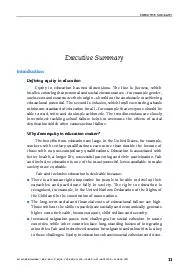
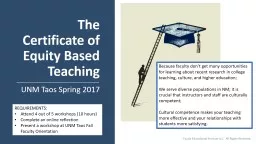
UNM Taos Spring 2017 Escala Educational Services LLC All Rights Reserved REQUIREMENTS Attend 4 out of 5 workshops 10 hours Complete an online reflection Present a workshop at UNM Taos Fall Faculty Orientation ID: 783997
Download The PPT/PDF document "The Certificate of Equity Based Teaching" is the property of its rightful owner. Permission is granted to download and print the materials on this web site for personal, non-commercial use only, and to display it on your personal computer provided you do not modify the materials and that you retain all copyright notices contained in the materials. By downloading content from our website, you accept the terms of this agreement.
Slide1
The Certificate of Equity Based Teaching
UNM Taos Spring 2017
Escala Educational Services LLC All Rights Reserved
REQUIREMENTS:
Attend 4 out of 5 workshops (10 hours)
Complete an online reflection
Present a workshop at UNM Taos Fall Faculty Orientation
Because faculty don’t get many opportunities for learning about recent research in college teaching, culture, and higher education;
We serve diverse populations in NM; it is crucial that instructors and staff are culturally competent;
Cultural competence makes your teaching more effective and your relationships with students more satisfying.
Slide2Why Colleges (and Classrooms) Aren’t Color Blind
Dr. Melissa L. Salazar, ESCALA Educational Services Amber Gordon, UNM Taos English Faculty and CASA
Session 2: Feb 17
Learning Goals:
Be able to:
Be able to define cultural competence in your own words;
Describe two ways an instructor can act as culturally competent in the classroom, to proactively bridge cultural gaps between students and the institution.
Slide3U.S. Higher Education: What do we know about the role gender, ethnicity, and poverty play?
Slide4Poll Everywhere will collect and display your response
Choose one method
PHONE:
Create a text message to
22333
In the body of the message type:
ESCALAEDUCATION
Hit return, look for a “you have joined session” reply
WEB:
Open this page on your computer
PollEv.com/
escalaeducation
Slide5Slide6Some myths about the U.S.
Latinx
population
1.
The population is escalating….Overall, the
Latinx population growth in the U.S. has slowed in cities: most growth in the Latinx
population is now occurring in the U.S. South and in North Dakota;2.
Illegal immigrants are increasing in number
…Most population growth in
Latinx
is from the U.S. born population,
not
new immigration;
3.
Most of the
Latinx
population is illegal
…The U.S.-born Hispanic population now exceeds the foreign- born Hispanic population.
Stepler
and Lopez, 2016.
“
U.S. Latino Population Growth and Dispersion Has Slowed Since Onset of the Great Recession.” Pew Research Center:
Hispanic Trends.
Slide7Slide8Slide9F
ewer Hispanic high school students are
are
dropping out…
Slide10…and young Hispanic c
ollege enrollment rates are zooming upwards...
Slide11A greater percentage of every group expects to graduate from college than they were in 1990.
Greatest gains in confidence are Black (+30 percentage points) and Hispanic (+26 percentage points) 10
th graders
Slide12Slide13Slide14Slide15And the completion rate between Hispanics and Whites is ~7-8 percentage points,
no matter what type of school they attend
Source: American Enterprise Institute. (2010). Rising to the Challenge: Hispanic College Graduation Rates as National Priority.
Slide16Slide17Poverty is correlated with educational outcomes more than any other factor
Sean Reardon, "School Segregation and Racial Achievement Gaps," and "The Geography of Racial/Ethnic Test Score Gaps
.
Available at Stanford University cepa.stanford.edu/
seda
/
Slide18What’s not a myth
:
Latinx
are over-represented in the U.S. poor (25% of all
Latinx live in poverty)
Slide19A
chievement gap between rich and poor children starts in Grade 3
Graphs from GradNation.org
Students from the most and least socioeconomically disadvantaged school districts
perform four grade levels apart on state standardized tests.
Source: “Local education inequities across U.S. revealed in new Stanford data set,”
Rabinovitz, April 29, 2016
Slide20Schools that serve a high percentage of poor children are:
Graphs from GradNation.org
More likely to have long-term substitutes or poorly qualified teachers
More likely to have turnover in their staff and administrators
Less likely to have college preparation courses
Is our ‘equal’ educational system working?
Slide21…the poverty gap exists in college completion too!
Wealthiest students
Poorest students
Slide22What does this data tell us about the impact of gender,
ethnicity, and/orpoverty in the college classroom?
Are each of these factors ‘cultures’?
Reflection Questions
Slide23Intriguing Statistics about Taos:What does this mean?
Graduation Rates51% Taos High71% Taos Academy77% Vista Grande
% Free/Reduced Lunch Rates83% Taos High51% Vista GrandeRemediation Rates When Students Enroll in College
Taos High 51% (just about the same as the state average)Taos Academy 71%Vista Grande 77%
Slide24