/
Rates of Change Honors  Precalculus Rates of Change Honors  Precalculus

Rates of Change Honors Precalculus - PowerPoint Presentation

blondield
blondield . @blondield
Follow
342 views
Uploaded On 2020-06-30

Rates of Change Honors Precalculus - PPT Presentation

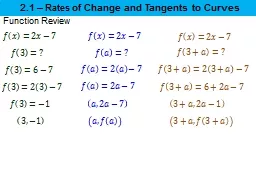
October 1718 2016 Mrs Agnew Essential Question How do you find the average rate of change of a function Essential Vocabulary Average Rate of Change Function Function Notation Average Rate of Change ID: 789500

function change average rate change function rate average graph increasing slope decreasing rates values find homework functions words difference

Share:

Link:

Embed:

Download Presentation from below link

Download The PPT/PDF document "Rates of Change Honors Precalculus" is the property of its rightful owner. Permission is granted to download and print the materials on this web site for personal, non-commercial use only, and to display it on your personal computer provided you do not modify the materials and that you retain all copyright notices contained in the materials. By downloading content from our website, you accept the terms of this agreement.


Presentation Transcript

Slide1

Rates of Change

Honors

Precalculus

October 17-18, 2016

Mrs. Agnew

Slide2

Essential Question

How do you find the average rate of change of

a function?

Essential Vocabulary

Average Rate of Change

Function

Function Notation

Slide3

Average Rate of Change

The rate of change of a given function from a to b is given by:

Average Rate of Change: rate at which the values of a function change as the variable changes.

Example: Average speed

Slide4

Rates of Change

Rates of change for linear functions are constant (rate of change = slope).

Rate of change varies for all other functions.

Let’s find the rates of change for different functions…

examples.

Slide5

Average Rate of Change

The average rate of change gives the slope of a SECANT line between x=a and x=b.

Let’s examine the graph of the

AROC

and a calculus expression known as the DIFFERENCE QUOTIENT.

Slide6

Homework:

page 90 – 92

#61, 65, 68

77(

c,d,e,f), 81 – 87

(Odd; only part a: Use Difference Quotient to find the AROC from a to a+h)

Slide7

Increasing and Decreasing

A function is said to be

increasing

when the graph has a positive slope.

In other words, the graph is rising.A function is said to be decreasing

when the graph has a negative slope.In other words, the graph is falling.

Slide8

Extreme Values

An extreme value is a maximum or minimum value of a function

Local extrema vs. absolute extrema

Maximum values occur when the function changes from increasing to decreasing

Minimum values occur when the function changes from decreasing to increasing.

Slide9

Homework:

Worksheet Provided