/
Pine Ridge Indian  Reservation Districts (2011) Pine Ridge Indian  Reservation Districts (2011)

Pine Ridge Indian Reservation Districts (2011) - PowerPoint Presentation

boyplay
boyplay . @boyplay
Follow
342 views
Uploaded On 2020-06-25

Pine Ridge Indian Reservation Districts (2011) - PPT Presentation

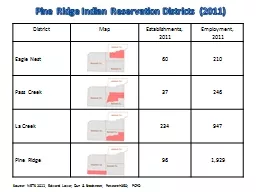
District Map Establishments 2011 Employment 2011 Eagle Nest 60 210 Pass Creek 37 246 La Creek 234 947 Pine Ridge 96 1929 Source NETS 2011 Edward Lowe Dun amp Bradstreet Research360 PCRD ID: 787193

amp 2011 indian ridge 2011 amp ridge indian reservation nets source research360 bradstreet dun lowe edward services pcrd pine

Share:

Link:

Embed:

Download Presentation from below link

Download The PPT/PDF document "Pine Ridge Indian Reservation Districts..." is the property of its rightful owner. Permission is granted to download and print the materials on this web site for personal, non-commercial use only, and to display it on your personal computer provided you do not modify the materials and that you retain all copyright notices contained in the materials. By downloading content from our website, you accept the terms of this agreement.


Presentation Transcript

Slide1

Pine Ridge Indian Reservation Districts (2011)

DistrictMapEstablishments, 2011Employment, 2011Eagle Nest60210Pass Creek37246La Creek234947Pine Ridge961,929

Source: NETS 2011, Edward Lowe; Dun & Bradstreet, Research360; PCRD

Slide2

DistrictMapEstablishments, 2011Employment, 2011White Clay

21139Wounded Knee921,054Porcupine27158Medicine Root51435

Pine Ridge Indian

Reservation Districts (2011)

Source: NETS 2011, Edward Lowe; Dun & Bradstreet, Research360; PCRD

Slide3

DistrictMapEstablishments, 2011Employment, 2011Unnamed

64524Pine Ridge Indian Reservation Districts (2011)Source: NETS 2011, Edward Lowe; Dun & Bradstreet, Research360; PCRDReservationMapEstablishments, 2011Employment, 2011Pine Ridge Indian Reservation

6825,642

Slide4

Pine Ridge Indian Reservation (2011)

NAICSIndustry SectorsEmployment, 2011Establishments, 2011Sales, 201111Agriculture, Forestry, Fishing & Hunting 199 91 $ 28,765,012

22

Utilities

90

7

$ 4,950,500

23

Construction

190

45

$ 27,297,995

31-33

Manufacturing

9

6

$ 12,526,400

42

Wholesale

91

19

$ 7,117,984 44-45Retail 280 46 $ 28,369,528 48-49Transportation & Warehousing 37 14 $ 27,791,000 51Information 34 9 $ 1,265,205 52Finance & Insurance 37 8 $ 1,165,000 53Real Estate Rental & Leasing 19 9 $ 2,745,960 54Professional, Scientific & Technical Services 383 55 $ 25,621,731 56Administrative Support, Waste Management, etc. 233 129 $ 68,941,768 61Educational Services 1,436 36 $ 10,372,475 62Health Care and Social Assistance 883 65 $ 22,242,600 71Arts, Entertainment and Recreation 17 6 $ 885,200 72Accommodation and Food Services 255 16 $ 2,738,200 81Other Services 244 69 $ 35,380,152 92Public Administration 1,175 47 $ 16,619,086 99Unknown 30 5 $ 858,250 TOTAL5,642682$ 325,654,046

Source: NETS 2011, Edward Lowe; Dun & Bradstreet, Research360; PCRD

Slide5

Source: NETS 2011, Edward Lowe; Dun & Bradstreet, Research360; PCRDPine Ridge Indian Reservation (2011)

Slide6

Source: NETS 2011, Edward Lowe; Dun & Bradstreet, Research360; PCRD

Pine Ridge Indian Reservation (2011)

Slide7

Purdue Center for Regional DevelopmentPurdue UniversityGerald D. and Edna E. Mann Hall, Suite 266203 Martin Jischke DriveWest Lafayette, IN 47907-2057