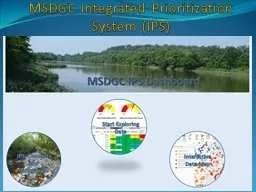
Ohio EPA Original IPS Concept Supports the Water Resource Restoration Sponsor Program WRRSP Used to prioritize and qualify WRRSP funded projects Based on identified aquatic life use impairments related to habitat ID: 813243
Download The PPT/PDF document "History of Integrated Prioritization Sys..." is the property of its rightful owner. Permission is granted to download and print the materials on this web site for personal, non-commercial use only, and to display it on your personal computer provided you do not modify the materials and that you retain all copyright notices contained in the materials. By downloading content from our website, you accept the terms of this agreement.
Slide1
History of Integrated Prioritization Systems
Ohio EPA
Original IPS Concept Supports the Water
Resource Restoration Sponsor
Program (WRRSP)
Used to prioritize and qualify WRRSP funded projects.
Based on identified aquatic life use impairments related to habitat.
DuPage
River Salt Creek Working
Group IPS
(DuPage Co., IL)
Based on rotating basin surveys and includes
consideration of:
Waterbody ecological potential;
“Restorability” of impairments revealed by monitoring and assessment;
Effectiveness of “doable” restoration
options;
Being updated in 2016 based on lessons learned.
Slide22
The IPS: A
Stronger Scientific Basis
for Setting Priorities and Decision-Making
Identify the most limiting stressors in receiving streams based on comprehensive monitoring and assessment (M&A).Develop a database and tools that can be queried (and applied) at the site, reach, and sub-watershed levels (HUC12).Identify the “highest return” projects – both restoration and protection options.Address required regulatory actions to attain WQS (e.g., NPDES, TMDLs, nutrients) while cost-effectively improving other aquatic life impairments (e.g., habitat).DuPage Salt Creek Watershed Workgroup (DRSCW), Upper Des Plaines Watershed (DRWW), and Metropolitan Sewer District of Greater Cincinnati (MSDGC) thus far.
Integrated Prioritization Systems
Slide3General Steps in IPS Develo
p
ment
Rotating
Watershed M&AProximate Causes & Sources of Impairment IdentifiedStressor Identification Process:Biocriteria Impairment with Stressor Threshold Analyses
Implement Management Actions:
CSO
SSO
Stormwater
Habitat
Other
IPS development
examines data at regional scale to refine thresholds for deriving restorability & susceptibility factors
Feedback
Results are made available via a “Dashboard” (ArcGIS, Power BI
,
etc.) with all supporting information in subsequent tabs.
Slide4Statistically Demonstrated
Stressor
Indicators: DRSCW 2010
Parameter mIBI fIBI
Riparian Score 5 RegressionRiffle Score 4 3Channel Score Regression 10Substrate Score 9 RegressionPool Score 7 7Chloride 141 mg/l 112 mg/lTKN Regression 1.0 mg/lBOD5 Regression
Regression
NH3N
Regression
0.15 mg/l
Habitat
Chemical
Slide5What is the IPS?
Allows users to
visualize and rank
aquatic life use aspects of CWA water quality issues:Identifies designated aquatic life uses (goals) for streams and rivers.Identifies aquatic life impaired reaches including severity and extent.Identifies causes of impairment.A standardized approach to viewing data linked to attainment of aquatic life uses.
Sites, reaches, and watersheds ranked by Restorability (for impaired waters) and Susceptibility & Threat (for attaining waters).
Slide6NE IL M&A and IPS Update
DRSCW
DRWW
IEPA
IEPA
LDPW
NBWW
Monitoring initiated in 2006 (DRSCW) – first Integrated Prioritization System (IPS) in 2010 after 3 years data collection.
IPS update and expansion across all four groups in NE Illinois in 2018.
M&A is ongoing – DRSCW added a 4
th
watershed in 2012; three new watershed groups added in 2016-17.
POTWs required to become dues paying members by NPDES permit condition.
Slide7DRSCW-DRWW M&A Relationship to IL EPA M&A
~5-6+ times the number of IL EPA sites per watershed – over extrapolation from single sites.
Little to no coverage of <5 mi.
2
by IL EPA – many unassessed streams.Overlap in stressors mostly at categorical level – differences in specific stressors.Minimal direct use of IL EPA data except for reference data adjacent to areas for IPS development.IL EPA M&A support for TMDLs limited to delineation of impaired segments.No IL biologically based stressor thresholds are available – a major IPS developmental task.
Slide8http://www.msdgc.org/initiatives/water_quality/index.html
The derivation of regionally relevant biological effect-based thresholds is an important first step.
Slide9Derivation of Stressor Benchmarks
Multiple options for stressor benchmarks:
Water quality criteria where they exist (ammonia, dissolved oxygen).
Regionally derived biological stressor benchmarks.Regional reference conditions (not effect based).Regionally derived benchmarks provide thresholds for parameters without WQ criteria and more relevant and accurate effect thresholds for parameters with statewide or otherwise outdated criteria.
Slide10Stressor Categories
Common Indicators
(Italic – Used in the IPS)
Habitat Diversity
QHEI, QHEI ChannelBedded Sediment
QHEI Substrate Metric
, QHEI Embeddedness and Silt Scores
Stream Flow Regime
Base Flow Index (LF),
HydroQHEI (LF), Impervious Surface
(LF/HF), Mean Sept Flows (LF)
Oxygen Demand
Minimum DO, BOD
Acid/Alkaline Conditions
pH
Dissolved Substances
Total Chloride, Conductivity, TDS
Suspended Substances
TSS
Nutrients
TP,
Nitrate, TKN
Conventional Toxics
Ammonia
Metals
Copper, Zinc, Lead, Manganese
Flood Plain/Land Use Quality
QHEI Riparian,
Buffer Land Use, Catchment Land Use (Heavy Urban)
MSDGC IPS
Variables & Endpoints
Slide11Stream Size
Aq. Life Use
IBI
Biocrit-eria
Ref ValuesMedian (IQR)Threshold ValuesHeadwaterEWH50
68 (64.5-74.0)
77.35
WWH
40
59.79
MWH
24
31.69
V. Poor
18
21.15
Wadeable
EWH
50
73.5 (67.5-80.0)
78.45
WWH
40
60.41
MWH
24
31.56
V. Poor
18
20.74
Boatable
EWH
48
83.5 (77.25-84.75)
76.65
WWH
38
60.06
MWH
24
36.83
V. Poor
18
26.88
QHEI (Habitat)
QHEI Stressor
Rank:
10
4
2
0
Slide12Stressor and Response
Variables
are
then Normalized to the Same Scale
Stressor Rank Guide
Narrative Description
Aquatic Life
Use Equivalent
Numeric Range
Excellent
Exceptional Warmwater Habitat (EWH)
0-2
Good
Warmwater Habitat (WWH)
2-4
Fair
Modified Warmwater Habitat (MWH)
4-6
Poor
Limited Resource Water (LRW)
6-8
Very Poor
Never Acceptable
8-10
Slide13Principal IPS Outputs
Slide14Individual Stressor and Response Variables (0-10 Scale)
Summary Restorability, Susceptibility and Threat Scores (0-100 Scale)
Narrative Condition Scale/Aquatic Life Use Tier
1
Stressor Rank
Restorability
Susceptibility
Threat
Excellent
EWH
0.1-2.0
A restorability score is not assigned to sites that attain their designated use.
50-100 High
Low 0-50
Good
WWH
2.01-4.0
0-50 Low
High 51-100
Fair
MWH
4.01-6.0
High 67-100
A susceptibility or threat score is not assigned to impaired sites.
Poor
LRW
6.01-8.0
Intermediate 34-66
Very Poor
-
8.01-10.0
Low 0-33
Restorability or Susceptibility/Threat Scores at Each Site, Reach, & Huc 12
Since Illinois lacks a TALU structure in their WQS we will need to develop and apply an equivalent structure within the NE Illinois IPS . . .
Slide15. . . we could use the IAWA sponsored effort to add tiered aquatic life uses to the Illinois WQS (2012) as a template.
Slide16IPS Dashboard
A watershed-based GIS platform for Lake County already exists – adding IPS results and information seems feasible.