/
Comparing Dissimilarity Measures for Symbolic Data Analysis Comparing Dissimilarity Measures for Symbolic Data Analysis

Comparing Dissimilarity Measures for Symbolic Data Analysis - PDF document

briana-ranney
briana-ranney . @briana-ranney
Follow
416 views
Uploaded On 2017-04-13

Comparing Dissimilarity Measures for Symbolic Data Analysis - PPT Presentation

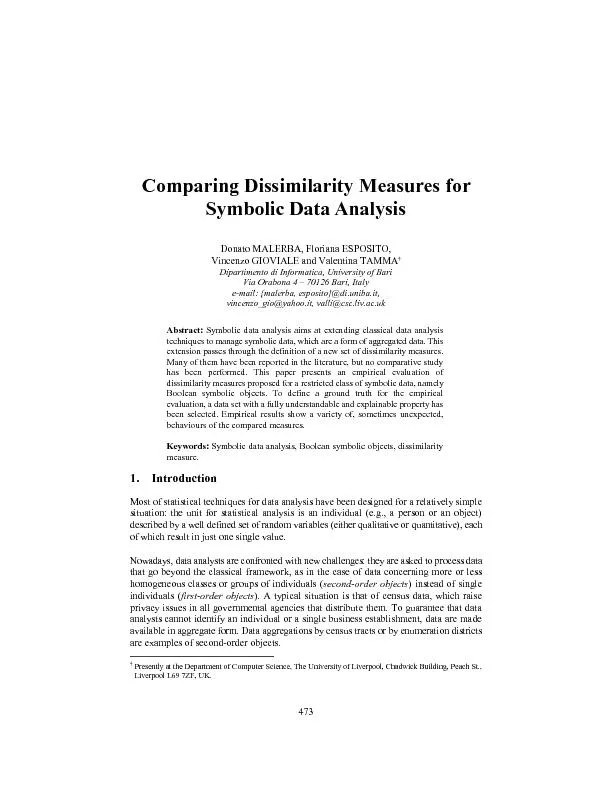
Presently at the Department of Computer Science The University of Liverpool Chadwick Building Peach StLiverpool L69 7ZF UKAbstract f dissimilarity measures proposed for a restricted class of ID: 339763

Presently the Department

Share:

Link:

Embed:

Download Presentation from below link

Download Pdf The PPT/PDF document "Comparing Dissimilarity Measures for Sym..." is the property of its rightful owner. Permission is granted to download and print the materials on this web site for personal, non-commercial use only, and to display it on your personal computer provided you do not modify the materials and that you retain all copyright notices contained in the materials. By downloading content from our website, you accept the terms of this agreement.


Presentation Transcript

Comparing Dissimilarity Measures forSymbolic Data AnalysisDonato MALERBA, Floriana ESPOSITO,Vincenzo GIOVIALE and Valentina TAMMADipartimento di Informatica, University of BariVia Orabona 4 – 70126 Bari, Italye-mail: {malerba, esposito}@di.uniba.it, Presently at the Department of Computer Science, The University of Liverpool, Chadwick Building, Peach St.,Liverpool L69 7ZF, UK.Abstract: f dissimilarity measures proposed for a restricted class of symbolic data, namelyBoolean symbolic objects. To define a ground truth for the empiricalevaluation, a data set with a fully understandable and explainable property has Donato Malerba, Floriana Esposito, Vincenzo Gioviale and Valentina Tamma Aggregated data describe a group of individuals by set-valued modal variables. Avariable defined for all elements of a set is termed set-valued with the domain if ittakes its values in }, that is the power set of . When ) is finite for each, than is called multi-valued. A single-valued variable is a special case of set-valuedvariable for which |)|=1 for each . When an order relation is defined on then thevalue returned by a set-valued variable can be expressed by an interval [], and Y istermed an interval variable. More generally, a modal variable is a set-valued variable witha measure or a (frequency, probability or weight) distribution associated to A class or group of individuals described by a number of set-valued or modal variables istermed symbolic data. Symbolic data lead to more complex data tables called symbolicdata tables. The extension of classical data analysis techniques to such tables is termedsymbolic data analysis [1]. Implementing an integrated software environment for both theconstruction of symbolic data tables from records of individuals and the analysis ofsymbolic data has been the general aim of the three-years ESPRIT project SODAS(Symbolic Official Data Analysis System), concluded in November 1999. The recentlystarted three-years IST project ASSO (Analysis System of Symbolic Official Data) isintended to improve the SODAS prototype with respect to several aspects (managementof symbolic data, new or improved data analysis methods, new visualization techniques).An important module of the SODAS software is that concerning the computation of somedissimilarity measures. Indeed, the extension of statistical techniques to symbolic datarequires the specification of some dissimilarity (or conversely, similarity) measures. Manyformulations of dissimilarity measures for symbolic data have been reported in literature[5], but no comparative study on their suitability to real-world problems has beenperformed. This paper presents an empirical evaluation of dissimilarity measures proposedfor a restricted class of symbolic data, namely Boolean symbolic objects (BSOs). To definea ground truth for the empirical evaluation, a data set with a fully understandable andexplainable property has been selected. Empirical results show a variety of, sometimesunexpected, behaviours of the compared measures. The reported experimentation is thefirst step towards the fulfillment of one of the objectives of the ASSO project, namelycomparing various dissimilarity measures to support users in selecting the best measure fortheir data analysis problem.Dissimilarity measures for Boolean Symbolic ObjectsHenceforth, the term dissimilarity measure on a set of objects refers to a real valuedfunction on such that: for all E. Conversely,similarity measureon a set of objects is a real valued function on such that:for all E. Generally, for eachobject in , and more specifically, = 1 while = 0. Studies on their properties can belimited to dissimilarity measures alone, since it is always possible to transform a similarity The SODAS software is freely distributed by CISIA at the following URL address: Comparing dissimilarity measures for symbolic data analysis measure into a dissimilarity one with the same properties. Many methods have beenreported in the literature to derive dissimilarity measures from a matrix of observed data[4], or, more generally, for a set of symbolic objects [5]. In the following, only somemeasures proposed for BSOs are briefly reported.Let and be two BSOs:a = 1=A1]  [Y2=A2]  ...  [Yp=Ap] b = 1=B1]  [Y2=B2]  ...  [Yp=Bp]where each variable takes values in a domain and and are subsets of . It ispossible to define a dissimilarity measure between two BSOs and by aggregatingdissimilarity values computed independently at the level of single variables componentwise dissimilarities). A classical aggregation function is the generalizedMinkowski metric. However, another class of measures defined for BSOs is based on thethe notion of description potential, ), which is defined as the of the Cartesianproduct A. For this class of measures, no componentwise decomposition is necessary, so that no function is required to aggregate dissimilarities computedindependently for each variable.The list of dissimilarity measures considered in this study are reported in Table 1, wherethey are denoted as in the SODAS software, namely:U_1: Gowda and Diday’s dissimilarity measure [6];U_2: Ichino and Yaguchi’s first formulation of a dissimilarity measure [7];U_3: Ichino and Yaguchi’s dissimilarity measure normalized w.r.t. domain length [7];U_4: Ichino and Yaguchi’s normalized and weighteddissimilarity measure [7];SO_1: De Carvalho’s dissimilarity measureeSO_2: De Carvalho’s extension of Ichino and Yaguchi’s dissimilarityySO_3: De Carvalho’s first dissimilarity measure based on description potential [3];SO_4: De Carvalho’s second dissimilarity measure based on description potential [3];SO_5: De Carvalho’s normalized dissimilarity measure based on description potential [3];C_1: De Carvalho’s normalized dissimilarity measure for constrained BSOs [3].The term constrained BSO refers to the fact that some dependences between variables aredefined, namely either hierarchical dependences (mother-daughter) which establishconditions for some variables being not measurable (not-applicable values), or logicaldependences which establish the set of possible values for a variable conditioned by theset of values taken by another variable . An investigation of the effect of constraints onthe computation of dissimilarity measures is out of the scope of this paper, nevertheless itis always possible to apply the measures defined for constrained BSOs to unconstrainedBSOs. This explains why C_1 has been considered in the empirical comparison reportedin the next section.Experimental evaluationMany dissimilarity measures have been proposed for symbolic data analysis, neverthelessthey have never been compared in order to understand both their common and theirpeculiar properties. In this section, an empirical evaluation is reported with reference to adata set for which a desirable behaviour of a dissimilarity measure can be defined. The dataset is called “Abalone data” and is available at the UCI Machine Learning Repository Donato Malerba, Floriana Esposito, Vincenzo Gioviale and Valentina Tamma Table 1. Dissimilarity measures available in the DI method for BSO’s, and relatedparameters.NameComponentwisedissimilarity measureObjectwise dissimilarity measure U_1 = D ) + Dwhere ) is due topositionis dueto spanningandis due to contentd(a, b) U_2) = (2where ) and join) are two Cartesianoperators. (a, b) = qpjjjB ,A 1 U_3 (a, b) = qpjjjB ,A1 U_4 (a, b) = qpjjjjB ,Aw1 SO_1) i=1, ...,5(a, b) = qpjjjijB ,Ad w1 SO_2 (a, b) =  qpjjjB ,A'p11 SO_3none(a, b) = (a b) (a b) + (2 b) (a) (b)) SO_4none a())b()a()ba(()ba()ba()b,a(dE'       where SO_5none ba())b()a()ba(()ba()ba()b,a(d'       23 C_1) i=1, ...,5(a, b) = where (j) is the indicator function Comparing dissimilarity measures for symbolic data analysis Table 2. Attributes of the Abalone data setAttribute NameData TypeUnitDescription SexNominalM, F. I (infant) LengthContinuousmmLongest shell measurement DiameterContinuousmmPerpendicular to length HeightContinuousmmMeasured with meat in shell Whole weightContinuousgramsWeight of the whole abalone Shucked weightContinuousgramsWeight of the meat Viscera weightContinuousgramsGut weight after bleeding Shell weightContinuousgramsWeigh of the dried shell RingsIntegerNumber of rings (URL: ). It contains 4177 cases of marinecrustaceans, which are described by means of the nine attributes listed in Table 2. Thereare no missing values in the data.Generally this data set is used for prediction tasks. The number of rings (last attribute) isthe value to be predicted from which it is possible to know the age in years of thecrustacean by adding 1.5 to the number of rings. Since the dependent attribute is integer-valued, this database has been extensively investigated in empirical studies concerningregression-tree induction [8,10]. The number of rings varies between 1 and 29, with samplemean equal to 9.934 and sample standard deviation equal to 3.224 (there are few cases ofcrustaceans with less than 3 or more than 25 rings). The performance of regression-treeinduction systems reported in the literature is generally high, meaning that the eightindependent attributes are actually sufficiently informative for the intended prediction task.In other words, two abalones with the same number of rings should also present similarvalues for the attributes sex, length, diameter, height, and so on. Basing upon thisconsideration we expect to observe that the degree of dissimilarity between crustaceanscomputed on the independent attributes do actually be proportional to the dissimilarity inthe dependent attribute (i.e., difference in the number of rings). We will call this propertyas monotonic increasing dissimilarity (shortly, MID propertyAbalone data can be aggregated into symbolic objects, each of which correspond to a rangeof values for the number of rings. In particular, nine BSOs have been generated byapplying the DB2SO facility [9] available in the SODAS software (see Table 3).The dissimilarity measures briefly presented in Section 2 have been applied to the BSOspreviously illustrated. In this example the value of the parameter is set to 0.5, the orderof power is 2 and the weights are uniformly distributed. Results are depicted in Figure1. Dissimilarities are reported along the vertical axis, while BSOs are listed along thehorizontal axis, in ascending order with respect to the number of rings. Each line representsthe dissimilarity between a given BSO and the subsequent BSOs in the list. The numberof lines in each graph is eight, since there are nine BSOs. For the sake of clarity, the lowertriangular matrix of the dissimilarities depicted in the graph labeled ‘Abalone- U_1’ isreported in Table 4. Donato Malerba, Floriana Esposito, Vincenzo Gioviale and Valentina Tamma Table 3. Boolean symbolic objects generated by partitioning the Rings attribute into nineintervals of equal lengthBSORingsSexLengthDiameterHeightWholeShuckedVisceraShell 11-3I,M[0.08:0.24][0.05:0.17][0.01:0.06][0.00:0.07][0.00:0.03][0.00:0.01][0.00:0.02] 24-6I,M,F[0.13:0.66][0.09:0.47][0.00:0.18][0.01:1.37][0.00:0.64][0.00:0.29][0.00:0.35] 37-9I,M,F[0.20:0.75][0.16:0.58][0.00:1.13][0.04:2.33][0.02:1.25][0.01:0.54][0.02:0.56] 410-12I,M,F[0.29:0.78][0.22:0.63][0.06:0.51][0.12:2.78][0.04:1.49][0.02:0.76][0.04:0.73] 513-15I,M,F[0.32:0.81][0.25:0.65][0.08:0.25][0.16:2.55][0.06:1.35][0.03:0.57][0.05:0.80] 616-18I,M,F[0.40:0.77][0.31:0.60][0.10:0.24][0.35:2.83][0.11:1.15][0.06:0.48][0.12:1.00] 719-21I,M,F[0.45:0.74][0.35:0.59][0.12:0.23][0.41:2.13][0.11:0.87][0.07:0.49][0.16:0.85] 822-24M,F[0.45:0.80][0.38:0.63][0.14:0.22][0.64:2.53][0.16:0.93][0.11:0.59][0.24:0.71] 925-29M,F[0.55:0.70][0.47:0.58][0.18:0.22][1.06:2.18][0.32:0.75][0.19:0.39][0.38:0.88] It is noteworthy that the MID property does not hold when the dissimilarity among BSOsis computed by means of Gowda and Diday’s measure (U_1). Surprisingly, old crustaceanswith a high number of rings (25-29) are considered more similar to very young crustaceanswith low number of rings (1-3) than to middle aged abalones with 1618 rings. Actually,for all numeric variables the dissimilarity components due to position (D) and content (Dincrease along the horizontal axis, while the component due to spanning (D) first increasesand then decreases. Spanning measures the difference between two interval widths andindeed BSO1 and BSO9 seem pretty similar due to the fact that continuous variables haveintervals with the same (small) width despite the fact that the intervals are quite distant.Incidentally, such intervals are relatively small since there are few cases of abalonesaggregated into BSO1 and BSO9. Thus, U_1 can lead to unexpected results in those casesin which BSOs are generated from unequally distributed cases with respect to a given classvariable, such as rings. Also for the dissimilarity measure U_2 the MID property does nothold and the first BSO is the most atypical. In particular, BSO1 and BSO7 are more similarthan BSO1 and BSO4. This can be explained by noting that the dissimilarity componentdue to meet () has no effect when is set to 0.5, while the join () of intervals inBSO1 and BSO7 is lower than the join of intervals in BSO1 and BSO4, since all numericalintervals of BSO7 are included in the corresponding intervals for BSO4. Generalizing, wenote that it is advisable not to nullify the effect of the meet operator by setting = 0.5,otherwise anomalous similarities can be found. Similar considerations apply to thedissimilarity measures U_3 and U_4, although their normalization factor (i.e., domainTable 4. Dissimilarity values computed by means of the dissimilarity U_1.Rings1-34-67-910-1213-1516-1819-2122-2425-29 1-3 4-612.71260 7-913.81076.10260 10-1213.69887.41843.86440 13-1513.23416.67414.01352.75760 16-1812.40397.77616.11475.20253.38630 19-2111.69267.80827.2636.83225.17713.09460 22-2411.32879.19468.00597.61766.17524.87423.55180 25-299.210111.749712.185112.006511.16229.87788.12617.40430 Comparing dissimilarity measures for symbolic data analysis 479 Figure 1. Graphs of ten dissimilarity measures for the abalone data. Abalone - U_11-34-67-910-13-16-19-22-25- Abalone - U_20,51,52,51-34-67-910-13-16-19-22-25- Abalone - U_40,050,10,150,21-34-67-910-13-16-19-22-25- Abalone - SO_10,10,20,30,41-34-67-910-13-16-19-22-25- Abalone - SO_20,050,10,150,20,251-34-67-910-13-16-19-22-25- Abalone - SO_30,30,60,91,21,51-34-67-910-13-16-19-22-25- Abalone - SO_40,10,20,30,41-34-67-910-13-16-19-22-25- Abalone - SO_50,30,60,91,21-34-67-910-13-16-19-22-25- Abalone - U_30,30,60,91,21,51-34-67-910-13-16-19-22-25- Abalone - C_11-34-67-910-13-16-19-22-25- Donato Malerba, Floriana Esposito, Vincenzo Gioviale and Valentina Tamma cardinality) tend to reduce the effect of the missing “meet” component. On the contrary,the normalization by the join volume ), proposed by De Carvalho in SO_2, totallyremoves the problem even when = 0.5, and the expected MID property is satisfied.The MID property is generally valid for SO_1 as well, and the atypical symbolic object isstill BSO1. However, in this case, the numerical variables have almost no effect on thecomputation of the dissimilarity, since the agreement index at the numerator of each namely ), is very small. As a matter of fact, the dissimilarity between twosymbolic objects is computed on the basis of the only nominal variable “sex.”In the case of SO_3, the atypical object is the third, while BSO1 is considered similar toall other symbolic objects, including BSO9. Once again, the contribution of the meet isnullified by setting = 0.5, nevertheless the situation is quite different from that presentedin the case of U_2. The effect of the join is multiplicative in the computation of thedescription potential defined by De Carvalho, while it is additive in Ichino and Yaguchi’sdissimilarity measures. In SO_3 small intervals can zero the dissimilarity, while in U_2they have practically no effect. On the contrary, a single large interval can have a strongimpact in U_2, while it may have no effect in SO_3. In the Abalone data set, small intervalsare obtained by applying the join operator to continuous variables of symbolic objectsBSO3. This explains the strange behaviour of lines depicted in the graph “Abalone –SO_3”. Also in SO_5, which is a normalized version of SO_3, the MID property is notsatisfied even though it has a more regular behaviour than SO_3 since the contribution ofthe join operator on numerical variables is reduced.Finally, in the case of C_1, the MID property is satisfied. According to this measure allsymbolic objects are quite dissimilar (the maximum distance is 1.0), and the most atypicalis that representing young abalones (BSO1).Summarizing, the following conclusions can be drawn from this empirical evaluation:Only three dissimilarity measures proposed by de Carvalho, namely SO_1, SO_2 andC_1, satisfy the MID property. For all these measures the less typical object is thatrepresenting very young abalones (BSO1).When BSOs are generated from unequally distributed cases with respect to a givenclass variable, the actual size of variable value sets might simply reflect the originaldistribution of cases. In particular, small value sets may be due to the scantiness ofcases used in the BSO generation process, while large value sets may occur becauseof the natural variability in a large population of cases used to synthesize BSOs.When this happens, distance measures based on the spanning factor (e.g., U_1) maylead to unexpected results.In Ichino and Yaguchi’s measures (i.e., U_2, U_3 and U_4), the contribution of themeet operator should not be nullified by setting the parameter to 0.5. Anintermediate value between 0 and 0.5 is generally recommended. Moreover, thenormalization proposed by de Carvalho (see SO_2) show better results. In the case of continuous variables, the width of value intervals is critical, sincedissimilarities measures based on additive aggregation tend to return high valueswhen only one componentwise dissimilarity is quite large, while measures based ondescription potential return small values when only one componentwise dissimilarityis quite small. Comparing dissimilarity measures for symbolic data analysis 4.ConclusionsIn symbolic data analysis a key role is played by the computation of dissimilarity measures.Many measures have been proposed in the literature, although a comparison thatinvestigates their applicability to real data has never been reported. The main difficulty wasdue to the lack of a standard in the representation of symbolic objects and the necessity ofimplementing many dissimilarity measures. The software produced by the ESPRIT ProjectSODAS has partially solved this problem by defining a suite of modules that enable thegeneration, visualization and manipulation of symbolic objects. In this work, a comparativestudy of the dissimilarity measures for BSOs is reported with reference to a particular dataset for which an expected property could be defined. Interestingly enough, such a propertyhas been observed only for some dissimilarity measures, which actually show very differentbehaviours. There are a number of possible directions for future research. One is toexperiment whether other data sets with fully understandable and explainable propertiesrelated to the proximity concept. Another direction is to extend the empirical evaluationto dissimilarity measure defined on probabilistic symbolic objects. A third direction is todevelop new dissimilarity measures for symbolic data that remove the two basicassumptions, namely variable independence and equal attribute relevance.AcknowledgementsThis work was supported partly by the European IST project no. 25161 (ASSO).References[1]Bock, H.H., Diday, E. (eds.): Analysis of Symbolic Data.Exploratory Methods for Extracting StatisticalInformation from Complex Data, Series: Studies in Classification, Data Analysis, and KnowledgeOrganisation, Vol. 15, Springer-Verlag, Berlin, (2000), ISBN 3-540-66619-2[2]de Carvalho, F.A.T.: Proximity coefficients between Boolean symbolic objects. In: Diday, E. et al.(eds.): New Approaches in Classification and Data Analysis, Series: Studies in Classification, DataAnalysis, and Knowledge Organisation, Vol. 5, Springer-Verlag, Berlin, (1994) 387-394.[3]de Carvalho, F.A.T.: Extension based proximity coefficients between constrained Boolean symbolicobjects. In: Hayashi, C. et al. (eds.): Proc. of IFCS’96, Springer, Berlin, (1998) 370-378.[4]Esposito, F., Malerba, D., Tamma, V., and Bock, H.H.: Classical resemblance measures. In: Bock, H.H,Diday, E. (eds.): Analysis of Symbolic Data. Exploratory Methods for extracting Statistical Informationfrom Complex Data, Series: Studies in Classification, Data Analysis, and Knowledge Organisation,Vol. 15, Springer-Verlag, Berlin, (2000) 139-152[5]Esposito, F., Malerba, D., Tamma, V.: Dissimilarity Measures for Symbolic Objects. In: Bock, H.H.,Diday, E. (eds.): Analysis of Symbolic Data. Exploratory Methods for extracting Statistical Informationfrom Complex Data, Series: Studies in Classification, Data Analysis, and Knowledge Organisation,Vol. 15, Springer-Verlag, Berlin, (2000) 165-185[6]Gowda, K. C., Diday, E.: Symbolic clustering using a new dissimilarity measure. In PatternRecognition, Vol. 24, No. 6, (1991) 567-578.[7]Ichino, M., Yaguchi, H.: Generalized Minkowski Metrics for Mixed Feature-Type Data Analysis. IEEETransactions on Systems, Man, and Cybernetics, Vol. 24, No. 4, (1994) 698-707[8]Robnik-Šikonja, M., Kononenko, I.: Pruning regression trees with MDL. In: Prade, H. (ed.): Proc. ofthe 13th European Conference on Artificial Intelligence, John Wiley & Sons, Chichester, England,(1998) 455-459.[9]Stéphan, V., Hébrail, G., and Lechevallier, Y.: Generation of Symbolic Objects from RelationalDatabases. In: Bock, H.H., Diday, E. (eds.): Analysis of Symbolic Data. Exploratory Methods forextracting Statistical Information from Complex Data, Series: Studies in Classification, Data Analysis,and Knowledge Organisation, Vol. 15, Springer-Verlag, Berlin, (2000) 78-105.[10]Torgo, L.: Functional Models for Regression Tree Leaves. In: Fisher, D. (ed.): Proc. of the InternationalMachine Learning, Morgan Kaufmann, San Francisco, CA, (1997) 385-393.