PPT-Fig 3:
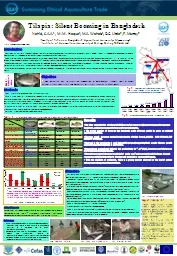
Gradual enhancement in tilapia production MT 3 Fig 1 Oreochromis niloticus Fig 8 A retailer of tilapia Fig 7 T ilapia with Prawn amp Carps Fig 6 Red
Download Presentation
"Fig 3:" is the property of its rightful owner. Permission is granted to download and print materials on this website for personal, non-commercial use only, provided you retain all copyright notices. By downloading content from our website, you accept the terms of this agreement.
Presentation Transcript
Transcript not available.