/
Fig. 4. Fig. 4.

Fig. 4. - PowerPoint Presentation

min-jolicoeur
min-jolicoeur . @min-jolicoeur
Follow
360 views
Uploaded On 2016-04-20

Fig. 4. - PPT Presentation

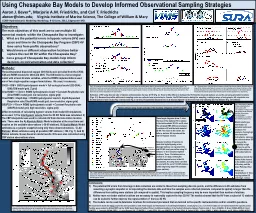
Target diagram showing how well the total 3D HV from each model is reproduced by different stations sets Sets correspond to min10 10 stations in the main stem Flanks The min10 stations plus the stations ID: 284931

model stations locations fig stations model fig locations hypoxic spatial time cbp volume grid bay estimates total models station

Share:

Link:

Embed:

Download Presentation from below link

Download Presentation The PPT/PDF document "Fig. 4." is the property of its rightful owner. Permission is granted to download and print the materials on this web site for personal, non-commercial use only, and to display it on your personal computer provided you do not modify the materials and that you retain all copyright notices contained in the materials. By downloading content from our website, you accept the terms of this agreement.


Presentation Transcript

pptx

Related Contents


Next Show more