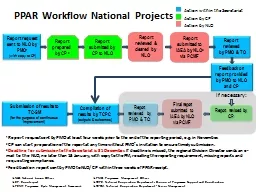
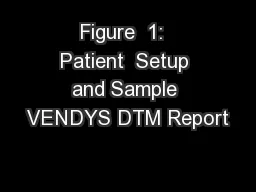
Above Illustration of patient setup with temperature sensors affixed to both index fingers and blood pressure cuffs on both arms Below left A sample report screen displays a right finger temperature curve red a left finger temperature curve blue and a Zero Reactivity Curve green ID: 704093
Download Presentation The PPT/PDF document "Figure 1: Patient Setup and Sample V..." is the property of its rightful owner. Permission is granted to download and print the materials on this web site for personal, non-commercial use only, and to display it on your personal computer provided you do not modify the materials and that you retain all copyright notices contained in the materials. By downloading content from our website, you accept the terms of this agreement.
Slide1
Figure 1: Patient Setup and Sample VENDYS DTM Report(Above) Illustration of patient setup, with temperature sensors affixed to both index fingers and blood pressure cuffs on both arms.(Below left) A sample report screen displays a right finger temperature curve (red), a left finger temperature curve (blue), and a Zero Reactivity Curve (green).(Below right) The software-generated, vascular reactivity curve is shown. The vascular reactivity index (VRI) is taken as the maximum value of this temperature curve during the reactive hyperemic period.
1Slide2
Figure 2A: Distribution of Vascular Reactivity Index (VRI)A histogram and cumulative percentage curve are shown.2ASlide3
WomenMen
Figure 2B: Distribution of Vascular Reactivity Index (VRI) by Gender
The percent of DTM tests falling into categories of poor, intermediate, and good vascular reactivity is shown for men (solid fill) and women (hatch fill).
2B
≥ 2Slide4
Figure 2C: Vascular Reactivity Index (VRI) and AgeA scatter plot, trend line, and Pearson’s r coefficient are shown. VRI was mildly and inversely correlated with age.
3Slide5
Figure 2D: Prevalence of Poor VRI in Different Age GroupsThe frequency of having a poor VRI score (VRI <1.0) is shown for the three age categories of age < 50y, age 50-70y, and age >=70y.
4A
≥ 70Slide6
Figure 2E: Distribution of Vascular Reactivity Index (VRI) in Oldest Age GroupThe percent of tests falling into categories of poor, intermediate, and good vascular reactivity
is shown for patients age >= 70 years.
4BSlide7
Table 1: Selected Patient and Test CharacteristicsTable 1: Selected Patient
and Test CharacteristicsFinger t300 = finger temperature at the onset of cuff occlusion (time300s); VRI = vascular reactivity index; NVRI = neurovascular reactivity index; Cold Finger = a flagged condition in which right finger t300 is equal to or less than 27°C; Sympathetic Response = a flagged condition in which left finger temperature continuously declines after right arm cuff occlusion
Variable
Mean ± SD or %(n)
Variable
Mean ± SD or %
Age (y)
65.5 ± 13.7
Cold Finger
5.8% (n=353)
Male / Female
54% / 46%
Sympathetic Response
4.8% (n=294)
Systolic blood pressure (mmHg)
138 ± 20
VRI score, overall
1.53 ± 0.53
Diastolic blood pressure (mmHg)
77 ± 12
VRI score, women
1.56 ± 0.58
Heart rate (bpm)
70 ± 13
VRI score, men
1.50 ± 0.49
Right finger t300 (°C)
32.1 ± 2.7
Left finger t300 (°C)
31.9 ± 2.8
Ambient temperature (°C)
24.3 ± 1.9Slide8
Table 2:
Multiple Linear Regression – Models for
VRI,
SBP, and DBP
VRI (Dependent)
R Square = 0.06, SE = 0.52
β
p-value
Intercept
1.885539
< 0.001
Age
-0.00826
< 0.001
DBP
0.003341
0.002
Male sex
-0.09741
< 0.001
SBP (Dependent)
R Square = 0.02, SE = 20.36
β
p-value
Intercept
119.3615425
< 0.001
VRI2.3040753460.001Age0.186886935< 0.001HR0.0672718650.018Male sex-0.4129602830.560 DBP (Dependent)R Square = 0.10, SE = 11.78βp-valueIntercept70.26680855< 0.001VRI1.796063985< 0.001Age-0.150770023< 0.001HR0.1759533< 0.001Male sex3.509046088< 0.001
Results are shown for four separate multiple linear regression models: VRI (vascular reactivity index),
SBP
(systolic blood pressure) and DBP (diastolic blood pressure). β = β coefficient; R Square = R2; SE = standard error. Units for variables were as follows: Age (y), HR (bpm), Sex (male = 1, female = 0), SBP and DBP (mm Hg). Slide9
Table 3:
Comparison between CVD Risk Assessment Methods
Table 3: Comparison between CVD Risk Assessment
Methods
Carotid IMT = carotid intima-media thickness; PWV = pulse wave velocity; AI = augmentation index;
C1/C2
= indices of large and small artery compliance (elasticity); FRS = Framingham Risk Score; SCORE = Systematic Coronary Risk Evaluation risk score system published by The European Society of Cardiology; QRISK2 = risk calculator developed by UK National Health Service; FMD = flow mediated dilatation; PAT = peripheral arterial tonometry; RHI = reactive hyperemia index; PPG = photoplethysmography for digital pulse waveform analysis; RI = reflection index; DTM = digital thermal monitoring; VRI = vascular reactivity
Method
Type (Structural, Functional, Risk Factors)
Independent of Age
Predictive Value
Response to Therapy
Ease of Use and Applicability in Primary Care Setting
Intra- and Inter -Observer Reproducibility
Self-Monitoring by Patients at Home
Coronary Artery Calcium
Structural
-
+++
-
+
+++
-
Carotid IMT and Plaque
Structural
-
++
+
+++ - Ankle Brachial IndexStructural-++-+++++-Arterial Stiffness (e.g., PWV, AI, C1/C2)Structural/Functional-+++++++- Risk Factor-Based Risk Calculators (e.g.,FRS, SCORE, QRISK2)Risk Factors-++n/a+++++++FMDFunctional+++
++
-
-
-
PAT (RHI)
Functional
+
++
++
+++
++
++
PPG (RI)
Functional
+
++
++
+++
++
++
DTM (VRI)
Functional
+
++
++
+++
++
+++Slide10
Burrowed fromCirculation JournalOfficial Journal of the Japanese Circulation Societyhttp://www.j-circ.or.jp
Secondary Prevention Strategy of Cardiovascular DiseaseUsing Endothelial Function TestingYasushi Matsuzawa, MD, PhD; Raviteja
R.
Guddeti
, MD;
Taek-GeunSlide11