/
Finalization of  Phase 6 Land Use Database, Finalization of  Phase 6 Land Use Database,

Finalization of Phase 6 Land Use Database, - PowerPoint Presentation

briana-ranney
briana-ranney . @briana-ranney
Follow
353 views
Uploaded On 2020-01-02

Finalization of Phase 6 Land Use Database, - PPT Presentation

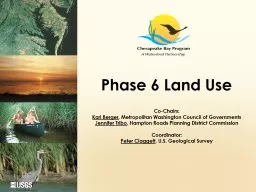
Finalization of Phase 6 Land Use Database version 2 Peter Claggett Fred Irani Quentin Stubbs Renee Thompson and Howard Weinberg October 22 2015 Scientific and Technical Advisory Committee Quarterly Meeting and Retreat ID: 771880

residential land 100 inr land residential inr 100 impervious tcir tcinr sum adj2 rural reduce lrseg acres proportionally wto

Share:

Link:

Embed:

Download Presentation from below link

Download Presentation The PPT/PDF document "Finalization of Phase 6 Land Use Databa..." is the property of its rightful owner. Permission is granted to download and print the materials on this web site for personal, non-commercial use only, and to display it on your personal computer provided you do not modify the materials and that you retain all copyright notices contained in the materials. By downloading content from our website, you accept the terms of this agreement.


Presentation Transcript

Finalization of Phase 6 Land Use Database, version 2 Peter Claggett, Fred Irani, Quentin Stubbs, Renee Thompson, and Howard Weinberg October 22, 2015 Scientific and Technical Advisory Committee Quarterly Meeting and Retreat Rose Haven, Maryland

Phase 6 Land Use v2 (pre-Ag Census)

Steps Merge local and regional land use datasets for 2011. Implement hierarchical rules to reconcile datasets . Summarize land uses within Federal Macro-agency parcels and Non-federal portions of LRSEGs. Estimate rural residential impervious and turf grass acres. Incorporate Maryland data. Mass balance LRSEG acres. Backcast to 1984, Forecast to 2013 . Proportionally allocate land uses to regulated areas. Fit the Census of Agriculture

Reconcile percentages of land uses at pixel level Combine 10m rasters of counties, federal lands, CSOs, MS4s, and 15 “land uses”: > 20 million records IR (impervious roads) INR (impervious non-roads) TCIR (tree canopy over roads) TCINR (tree canopy over other impervious) TCH (tree canopy over herbaceous) TG (turf grass) OSP (open space) FOR (forest) WTT (tidal wetland) WTF (non-tidal floodplain wetland) WTO (non-tidal other wetland) WAT (open water) DEV (developed areas) CROP (cropland) PAST (pasture)

Impervious Surfaces IR – TCIR = IR_adj INR – TCINR = INR_adj If ( IR_adj + TCIR + INR_adj + TCINR) > 100, reduce INR_adj and TCINR values proportionally in new fields INR_adj2 and TCINR_adj so that the sum of these land uses <= 100. WaterIf (IR_adj + TCIR + INR_adj2 + TCINR_adj + WAT) > 100, reduce WAT in new field WAT_adj so that the sum of these land uses <= 100. WetlandsIf (WTF + WTO + WTT) > 100, reduce WTT in new field WTT_adj so that the sum of these land uses <= 100. If (IR_adj + TCIR + INR_adj2 + TCINR_adj + WAT_adj + WTF + WTO+ WTT_adj) > 100, reduce WTF, WTO, and WTT_adj proportionally in new fields WTF_adj, WTO_adj, and WTT_adj2.ForestsIf (IR_adj + TCIR + INR_adj2 + TCINR_adj + WAT_adj + WTF_adj + WTO_adj + WTT_adj2 + FOR) > 100, reduce FOR in new field FOR_adj so that the sum of these land uses <= 100. Implement Hierarchical Rules (coded in SQL and FORTRAN)

Implement Hierarchical Rules (coded in SQL and FORTRAN) Turf Grass For all pixels where DEV = 1, Add CROP and PAST fractions to TG in new field TG_adj.Add TCH fractions to new field TCT If (IR_adj + TCIR + INR_adj2 + TCINR_adj + WAT_adj + WTF_adj + WTO_adj + WTT_adj2 + FOR + TCT + TG_adj) > 100, reduce TCT and TG_adj proportionally in new fields TCT_adj and TG_adj2 so that the sum of these land uses <= 100. For all pixels where DEV = 0,Add TG fractions proportionally to CROPLAND and PASTURE in new fields Crop_adj and Past_adj.Add TCH fractions to new field TCSIf (IR_adj + TCIR + INR_adj2 + TCINR_adj + WAT_adj + WTF_adj + WTO_adj + WTO_adj2 + FOR + TCS + CROP_adj + PAST_adj) > 100, reduce just TCS in new field TCS_adj. Open SpaceIf the sum of all adjusted fields including OS < 100, then add the difference proportionally to all land uses with values > 0 including OS, saved as new field OS_adj.

Estimate Rural Residential Impervious and Turf Calculate the total number of housing units outside areas classified as “developed” = THU10_unDEV THU10_unDEV * (Average impervious acres per rural residential lot) = Rural residential i mpervious. (THU10_unDEV * (Average rural residential lot size 1 ) * (LRSEG proportion of herbaceous vegetation within 100m of roads)) – (Rural residential impervious) = Rural residential turf grass.1 Avg. rural lot size in MD = 2.24 acresMedianSuburbanRuralDC0.0730.177DE0.1160.149MD0.1350.177 NY 0.095 0.113 PA 0.077 0.148VA0.0850.150WV0.0760.109All States0.0940.140 Impervious Acres per Lot

Incorporate Maryland P6 Land Use Data MDE and MDP provided 2011 land use acreage estimates for federal and non-federal portions of LRSEGs for all counties in Maryland except: Somerset, St. Mary’s, Worcester, Washington, and Garrett. Data were provided for the following land uses.IRINRTCI TCTTCSTGFORWTFWTOWTT (not used)CBPO supplemented these data with information on:OSPWATWTTCROPPAST

Mass Balance Total Acres per LRSEG If sum of all land uses > LRSEG area, reduce Open Space and Forest proportionally. Add Maryland land use data. I f sum of all land uses > LRSEG area, reduce all land uses proportionally.Outside Maryland, add rural residential turf grass and impervious. If sum of all land uses > LRSEG area, reduce rural residential turf grass and impervious fractions using proportions of original turf grass and impervious non-road acreages.Agricultural area = LRSEG area – (sum of all adjusted land uses + tidal wetlands)

Backcast Land Uses to 2006, 2001, 1992, and 1984 Estimate absolute change in Total Housing Units Estimate proportion of Total Housing Units that are single detached Estimate a verage residential lot size for single-detached housesCalculate percent change in:Residential land useForest/tree canopy coverAgricultural land coverAdjust land use acreages to reflect historic conditions:IR_06 = IR_11 + (IR_11 * (% Δ Residential) * (Proportion of IR associated with INR) INR_06 = INR_11 + (IR_11 * (% Δ Residential))TG_06 = TG_11 + (TG_11 * (% Δ Residential))

Backcast Land Uses to 2006, 2001, 1992, and 1984 TCIR_06 = TCIR_11 + (TCIR_11 * (% Δ Residential) * (Proportion of IR associated with INR) TCINR_06 = TCINR_11 + (TCIR_11 * (% Δ Residential))TCT_06 = TCT_11 + (TCT_11 * (% Δ Residential))TCS_06, OSP_06, AG_06 =TCS_11 + (TCS_11 * (% Δ Agriculture) * (Proportion of TCS_11 to sum of TCS, OSP and AG))FOR_06 = FOR_11 + (FOR_11 * (% Δ Forest)) + (Δ Tree Canopy Classes 2011 – 2006)WTF, WTO, and WAT held constant through time.If sum of all 2006 land uses > LRSEG area, reduce TCT, TCS, OSP, FOR, and AG proportionally.

Steps Merge local and regional land use datasets for 2011. Implement hierarchical rules to reconcile datasets . Summarize land uses within Federal macro-agency parcels and non-federal portions of LRSEGs. Estimate rural residential impervious and turf grass acres. Incorporate Maryland data. Mass balance LRSEG acres.Backcast to 1984, Forecast to 2013.Proportionally allocate developed land uses to regulated areas (e.g., CSS and MS4s) keeping CSS acreages constant through time by adjusting open space fraction.Fit the Census of Agriculture

Fit the Census of Agriculture Interpolate land use acreages to Census years: 1982, 1987, 1992, 1997, 2002, 2007, 2012. Distribute all crops reported in the Census from counties to LRSEGs based on the proportion of a County’s agricultural area within each LRSEG. If land use acres + Census of Agriculture > LRSEG acres Subtract acres sequentially (if needed) from: open space, non-regulated tree canopy, forest, non-CSS developed land uses, and agriculture (non-animal feeding space).