/
Scientific investigation & Scientific investigation &

Scientific investigation & - PowerPoint Presentation

briana-ranney
briana-ranney . @briana-ranney
Follow
343 views
Uploaded On 2019-06-20

Scientific investigation & - PPT Presentation

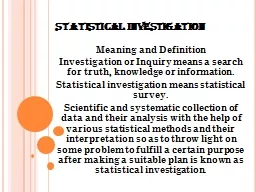
mapping Scientific Method A scientific theory is a wellsubstantiated explanation of some aspect of the natural world based on a body of facts that have been repeatedly confirmed through observation and experiment Scientists create scientific theories from hypotheses that have been corrob ID: 759292

lines scientific elevation law scientific lines law elevation density contour longitude called topographic maps theories run measured latitude practice principle relationship independent

Share:

Link:

Embed:

Download Presentation from below link

Download Presentation The PPT/PDF document "Scientific investigation &" is the property of its rightful owner. Permission is granted to download and print the materials on this web site for personal, non-commercial use only, and to display it on your personal computer provided you do not modify the materials and that you retain all copyright notices contained in the materials. By downloading content from our website, you accept the terms of this agreement.


Presentation Transcript

Slide1

Scientific investigation & mapping

Slide2

Scientific Method

A

scientific theory

is a well-substantiated explanation of some aspect of the natural world, based on a body of facts that have been repeatedly confirmed through observation and experiment. Scientists create scientific theories from hypotheses that have been corroborated through the scientific method, then gather evidence to test their accuracy.

A

scientific law

or scientific principle is a concise verbal or mathematical statement of a relation that expresses a fundamental principle of science, like Newton's law of universal gravitation. A scientific law must always apply under the same conditions, and implies a causal relationship between its elements. The law must be confirmed and broadly agreed upon through the process of inductive reasoning.

Like theories and hypotheses,

laws make predictions

(specifically, they predict that new observations will conform to the law), and can be falsified if they are found in contradiction with new data.

Slide3

Reading Graphs

Independent variable goes on the x-axis, dependent on the y-axisConstants are things that stay the same in an experimentControl group is the group that you do not manipulate… independent variable is not applied

Slide4

What is Density?

Density is defined as the mass of an object per unit volume. It is the relationship between the mass and volume of a certain objectSo what does that mean?If the molecules are more compact or packed together, it is said to have more density.If they are loosely packed, they are said to be less dense.

Slide5

How to Solve for Density

It’s simple….D = m/v!Cover up what you want to solve for and go for it!If the values are on top of each other, you divide. If they are next to each other, you multiply.

Slide6

Latitude & Longitude

Lines of latitude run horizontally and are measured north and south of the equator (0o)Lines of longitude run vertically and are measured east and west of the prime meridian (0o)180o longitude line is the International Date Line.

Slide7

Practice with Coordinates

30 N, 100 W

39 N, 87 W

25 N, 78 W

43 N, 121 W

47 N, 94 W

Slide8

Topographic Mapping

Topographic maps show differences in the

elevation of the Earth’s surfaceLines connecting points of equal elevation are called contour lines; contour lines already marked with an elevation are called index contours; the distance between side by side contours is called the contour intervalContour lines that are close together indicate steep elevation, and contour lines farther apart indicate gentle elevationBenchmarks are located on the tops of mountains or hills that tell the exact elevation

Slide9

Practice with Topo Maps