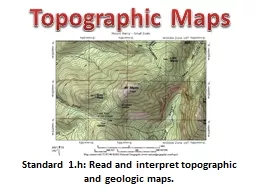
/
Standard 1.h: Read and interpret topographic and geologic m Standard 1.h: Read and interpret topographic and geologic m

Standard 1.h: Read and interpret topographic and geologic m - PowerPoint Presentation

briana-ranney
briana-ranney . @briana-ranney
Follow
382 views
Uploaded On 2017-01-18

Standard 1.h: Read and interpret topographic and geologic m - PPT Presentation

Topographic Maps Contouring Topographic contours indicating surface relief Image taken from US Army training manual Solid yellow lines represent surface isobars line of equal air pressure Green dashed lines are geopotential heights the altitude at which 500 millibars of air pressure are at ID: 511297

map contour maps lines contour map lines maps elevation topographic surface pressure change wind interval scale air equal line

Share:

Link:

Embed:

Download Presentation from below link

Download Presentation The PPT/PDF document "Standard 1.h: Read and interpret topogra..." is the property of its rightful owner. Permission is granted to download and print the materials on this web site for personal, non-commercial use only, and to display it on your personal computer provided you do not modify the materials and that you retain all copyright notices contained in the materials. By downloading content from our website, you accept the terms of this agreement.


Presentation Transcript

Slide1

Standard 1.h: Read and interpret topographic and geologic maps.

Topographic MapsSlide2

Contouring

Topographic contours indicating surface relief. Image taken from US Army training manual.

Solid yellow lines represent surface isobars, line of equal air pressure. Green dashed lines are geopotential heights, the altitude at which 500 millibars of air pressure are attained. These types of contour maps are used by meteorologists. The weather system shown is the Storm of the Century, a powerful winter storm called a nor’easter.

In this lesson, you will learn about the ways to show three dimensions on a flat map, how to read topographic maps and other contour map types, and how to draw contours.Slide3

Topographic Maps

Detailed maps showing the elevations of hills and valleys of an area.Use lines, symbols, and

colors to represent changes in elevation

and

features on

Earth’s surface.

Topo

graphy = shape of the landSlide4
Slide5

These

topographic maps

combine shading

,

color, and contour lines. Slide6

Contour Lines

Contour lines are used to

represent

the three dimensional surface of the world on a flat

map.

Can also be called isolines

or isopleths.

What do you notice about the map on the right?Slide7

A

contour line connects points of equal elevation.Elevation refers to the distance of a location above or below sea level.Contour lines never cross.Slide8

contour lines marked with elevation

Index ContoursSlide9

Contour Intervals

distance in elevation change between each contour lineSlide10

The contour interval is 20 ft. Point elevations are

:A = 700 ftB = 740 ftC = 770 ftD = 820 ft

Uphill

direction

Slow change in elevation. Contour lines

far apart.

Rapid change in elevation. Contour lines

Close together.Slide11
Slide12

Widely spaced contour lines show a gentle slope. When they are close together, the slope is steep.

Spacing between Contour LinesSlide13

When the contour lines are close together at the top of a hill, the hilltop is pointed.

When the contour lines are widely spaced, the hilltop is flat.Slide14

Contour line rules

Contours are imaginary lines that join equal values of whatever is being mapped. For example, the 100 ft contour marks all areas on a map that are 100 ft in elevationContour lines are defined by a contour interval. The contour interval tells you the amount of elevation change between contour lines.

The contour interval for a map is constant unless otherwise noted.Slide15

When contour lines are close together, the change in elevation increases very quickly (steep).

When the contour lines are spread apart, the amount of elevation change is small (flat).Contour line rulesSlide16

You are to hike to the top of Blake Island.

Which side of Blake Island would be the steepest climb, the west coast or the north coast?

W

N

(The west coast because the contour lines are closely spaced. You have a very large amount of change in elevation over a short distance. Go to the north for a more gentle climb)Slide17

Contour maps allow you to interpret the “lay of the land”. From surveyors to soldiers, the ability to read the topography in a topographic map is essential. Review the following topographic maps and learn to identify the features shown.Slide18

The V’s point upstream in a draw. Where you see a draw in a topographic map you can reasonably assume there is or has been water flowing that

led to the erosion and migration of the contour lines.Slide19
Slide20
Slide21
Slide22
Slide23
Slide24
Slide25

Match the letter and numberSlide26

There are many types of contour maps

Topographic (relief) mapsBathymetric (sea floor elevation) mapsIsohyet (rainfall) mapsIsopach (rock or sediment thickness) mapsIsotach (wind speed) mapsIsobaric (air pressure) maps

Geopotential

height (elevation of a given air pressure) mapsSlide27

U.S. Geological Survey topographic map

Very common topographic mapEntire US covered by these mapsSize of each maps is 7.5 minutes by 7.5 minutes (30 minutes make 1 degree of longitude or latitude)

Scale of these maps is 1:24,000 (1 inch = 2000 ft/24,000 in)

Also known as a topographic quadrangleSlide28

Bathymetry map. Shows depth of seafloor. Slide29

Isobars (solid yellow lines) on an isobaric

map.This is a strong low pressure system, which produced large amounts of snow and wind across the eastern US.In an isobaric map, where isolines are close together, winds are the strongest. Winds are strongest in Virginia, North Carolina,and West Virginia.Green dashed lines are geopotential

heights, the altitude at which 500

millibars

of air pressure are attained.Slide30

Isohyet

map. Rainfall distribution on August 17th – 20th, 2002 (isohyets are in millimeters) Slide31

Isohyet map showing predicted rainfall in inchesSlide32

Isopach lines (contour interval = 5 ft) show the thickness of a rock layer known to produce oil. The round symbols are oil well locations and the depths (6000 – 7000 ft) drilled to reach oil. Slide33

Isopach map showing

thickness of the limestonecomprising the Florida AquiferSlide34

Colored areas represent

isotachs, lines encompassing areas of equal windspeed. Contour interval = 10 knots. The red area is a fast region of wind comprising of the polar jet stream. It flows from west to east, something that you cannot infer from this map unless the mapmakers were to plot wind barbs, arrows to indicate the direction of wind flow.Green lines are geopotential heights (air pressure).Slide35

These features are represented by different symbols.

A map legend explains what the symbols on a map represent.Topographic maps and most other maps include both human-made and natural features that are located on Earth’s surface.

Map LegendSlide36

A

map scale is the ratio between distances on a map and actual distances on the surface of Earth.Map Scales

When using a map, you need to know how to measure distances.Slide37

There are three types of map scales: verbal scales, graphic scales, and fractional scales.

A verbal scale expresses distance as a statement, such as “One centimeter is equal to one kilometer.” A graphic scale consists of a line that represents a certain distance, such as 5 km or 5 miles.

A

fractional scale

expresses distance as a ratio,

such as 1:63 500.

Map ScalesSlide38

What does it mean if a map says

“Scale 1:100 000”?This fractional scale means that one unit on the map represents 100 000 units on Earth’s surface. For example, one inch on the map would equal 100 000 inches on Earth’s surface.Slide39

This is a map of

geopotential heights. Contour interval is 60 meters.Note that the wind barbs in this map convey the direction of wind flow, which is predominantly west to east at this altitude.