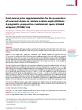
/
www.thelancet.comVol 375   June 5, 2010LancetAga Khan University, Kara www.thelancet.comVol 375   June 5, 2010LancetAga Khan University, Kara

www.thelancet.comVol 375 June 5, 2010LancetAga Khan University, Kara - PDF document

briana-ranney
briana-ranney . @briana-ranney
Follow
422 views
Uploaded On 2016-05-07

www.thelancet.comVol 375 June 5, 2010LancetAga Khan University, Kara - PPT Presentation

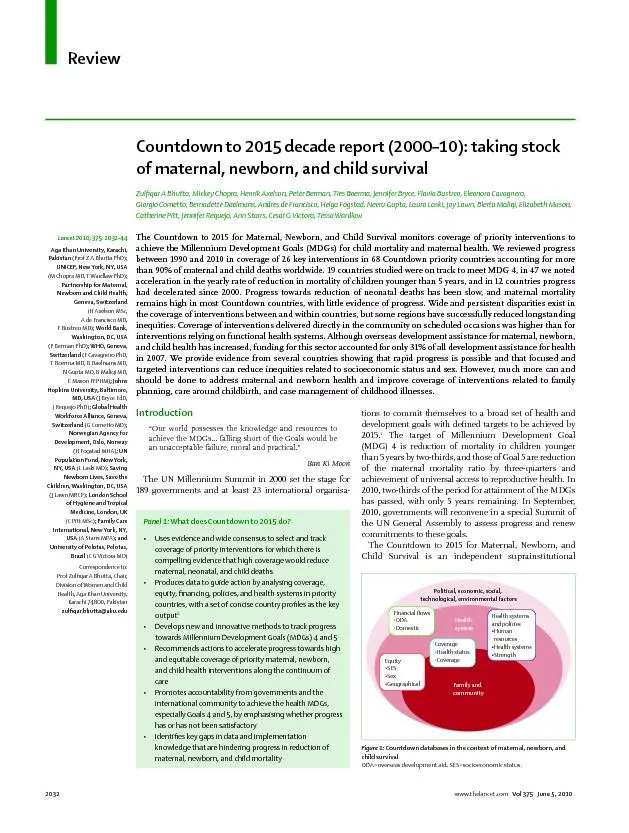
Review 10TL27251Editor LB XxxxxIllustrator J HigginbottomDate 120510YNURGENTText typedImage redrawnChecked by Family and communityHealth systemPolitical economic social technological envir ID: 309210

Review 10TL_2725_1Editor XxxxxIllustrator: HigginbottomDate:

Share:

Link:

Embed:

Download Presentation from below link

Download Pdf The PPT/PDF document "www.thelancet.comVol 375 June 5, 2010L..." is the property of its rightful owner. Permission is granted to download and print the materials on this web site for personal, non-commercial use only, and to display it on your personal computer provided you do not modify the materials and that you retain all copyright notices contained in the materials. By downloading content from our website, you accept the terms of this agreement.


Presentation Transcript

Review www.thelancet.comVol 375 June 5, 2010LancetAga Khan University, Karachi, Pakistan (Prof Z A Bhutta PhD)UNICEF, New York, NY, USA (M Chopra MD, T Wardlaw PhD)Partnership for Maternal, Newborn and Child Health, (H Axelson MSc, A de Francisco MD, ; World Bank, Washington, DC, USA ; WHO, Geneva, (E Cavagnero PhD, T Boerma MD, B Daelmans MD, N Gupta MD, B Maliqi MD, Hopkins University, Baltimore, MD, USA (J Bryce EdD, J Requejo PhD); Global Health Workforce Alliance, Geneva, (G Cometto MD)Norwegian Agency for Development, Oslo, Norway (H Fogstad MHA); UN Population Fund, New York, NY, USA ; Saving Newborn Lives, Save the Children, Washington, DC, USA (J Lawn MRCP)of Hygiene and Tropical Medicine, London, UK ; Family Care International, New York, NY, (A Starrs MPA)University of Pelotas, Pelotas, (C G Victora MD)Correspondence to:Prof Zulqar A Bhutta, Chair, 10TL_2725_1Editor LB XxxxxIllustrator: J HigginbottomDate: 12/05/10YNURGENT?Text typedImage redrawnChecked by: Family and communityHealth systemPolitical, economic, social, technological, environmental factors Financial owsODADomesticHealth systemsHuman resourcesHealth systemsStrengthCoverageHealth statusCoverage EquitySESSexGeographical Figure : Countdown databases in the context of maternal, newborn, and ODA=overseas development aid. SES=socioeconomic status. Panel : What does Countdown to 2015 do?• Uses Review www.thelancet.comVol 375 June 5, 2010 Mortality rate in children younger than 5 years (deaths per 1000 livebirths)Average annual rate of reduction (%)On/o track*On trackOn trackOn trackOn trackOn trackBurkina FasoRepublicOn trackCongo (Brazzaville)d’IvoireDR CongoOn trackEquatorial GuineaOn trackOn trackOn trackOn trackOn track174On trackOn trackOn track On trackNorth KoreaPakistanPapua New GuineaPeruOn track(Continues on next page) Review www.thelancet.comVol 375 June 5, 2010 initiative that was established in 2005. Its primary objective is to gather and present data for use by countries and the global health community to stimulate action on the healthrelated MDGs. The initiative is a collaboration of academics, UN agencies, nongovernmental organ-isations, healthcare professional associations, donors, and governments, with The Lancet as a key partner. Countdown specically focuses on key evidenceinterventions that have been proven to improve maternal, newborn, and child health and survival. The work of Countdown addresses not only the fourth and fth MDGs, but also MDG 1 through action on nutrition, MDG 6 on HIV/AIDS and malaria, MDG 7, which includes water and sanitation, and MDG 8 through a Evolution of CountdownCountdown provides a common framework to track coverage of proven interventions and measures of mortality and nutrition in countries with the highest burden of mortality in mothers and children. In 2005, the rst Countdown report included 60 countries and 17 interventions, and focused on child survival. The process thereafter evolved to focus on the continuum of care from prepregnancy through to pregnancy, childbirth, the postnatal period, and early childhood. At present, Countdown tracks coverage for interventions that have proven eectiveness to reduce maternal, newborn, and child mortality and improve maternal health in the 68 countries that together account for at least 95% of maternal and child deaths worldwide. Countdown mechanisms generate evidence of progress and use country proles, publications, conferences, and other means to advance use of data for national and global action. The 2008 Countdown meeting in Cape Town was Mortality rate in children younger than 5 years (deaths per 1000 livebirths)Average annual rate of reduction (%)On/o track*On track174South AfricaTajikistanTanzaniaTogoTurkmenistanOn trackYemenZimbabweRepublicyoungeryearslivebirths,livebirthsaverageunder-5livebirthsbetweenunder-5livebirthslowerTable : Progress towards Millennium Development Goal 4 PMTC 100 020406049%31%83%54%67%82%79%85%48%27%3041%41%7111%48%38%34%22%8%80 Prepregnancy Pregnancy Birth Postnatal Neonatal Infancy Childhood Figure : Median coverage for eective maternal, newborn, and child interventions in 68 Countdown countriesavailablePMTCT=preventionHIV.IPTp=intermittentpreventivetreatmentformalaria.DPT3=diphtheria,pertussis,andtetanus.ITNs=insecticide-treatedbednets.*Targetcoveragerateisnot100%. Review www.thelancet.comVol 375 June 5, 2010 linked to the meeting of the InterParliamentary Union and was intended to engage politicians and policy makers in issues related to maternal, newborn, and child health An important Countdown function is identication of key gaps in data and evidence, and stimulation of development of methods and instruments to improve assessment of coverage. Countdown indicators and methods have changed in response to new evidence and improved methods, but the principal aim of Countdown has not altered—ie, to assess every 2 or 3 years until 2015 whether proven interventions and approaches are reaching women and children in greatest need, especially marginalised populations and those living in poverty. Tracking of single biologically based interventions has been complemented by inclusion of broad packages such as antenatal or postnatal care that can serve as platforms for delivery of several interventions. The list of priority countries has also expanded and attempts are being made to include an increased range of indicators including adolescent and reproductive health as well as social determinants of health. Adolescent birth rate, a tracking Countdown focuses not only on intervention coverage, but also on major determinants of coverage, including strength, policies, and nancial ows of health systems, with a focus on the relation between socioeconomic and sex inequities and intervention coverage (panel 1). These areas of emphasis are part of a broad conceptual framework guiding secondary analyses of Countdown data and are consistent with the Paris Declaration on Aid and the monitoring and evaluation framework for healthsystems strengthening that was developed by a working group of representatives from WHO, the World Bank, the Global Alliance for Vaccines and Immunisation, and the Global Fund to Fight AIDS, Tuberculosis and Malaria.Countdown uses a conceptual model that is based on the WHO healthsystems framework, which proposes that six linked and overlapping components of a health system (service delivery, health workforce, information, medical products, vaccines and technologies, and nancing and leadership or governance) operate through Survey year(s)Most recent livebirths delivered by Total South AfricaPeruPakistand’IvoireZimbabweDR CongoCongo (Brazzaville)TanzaniaTurkmenistan Survey year(s)Most recent livebirths delivered by Total Burkina FasoavailableRepublicthe Congo.Table : Percentage of most recent livebirths delivered by caesarean section in Countdown countries, total and for women living in urban Review www.thelancet.comVol 375 June 5, 2010 the desirable attributes of improved access, coverage, quality, and safety to improve health and other outcomes (responsiveness, social and nancial risk protection, and improved eciency). The framework reects properties of all complex systems, including basic principles of nonlinearity, interconnectedness, and synergy between systems elements and building blocks. Work is also underway to include elements that are indicative of social determinants of health. These elements include those contributing to excess risk of illness and undernutrition due to inadequate diet and food insecurity, poor environmental conditions including housing and sanitation, and factors such as sex discrimination and low levels of female education and empowerment that Tracking of intervention coverageCountdown draws on four linked databases of coverage, health systems and policies, nancial ows, and equity (gure 1) that combine data abstracted from existing global databases with new analyses relevant to maternal, newborn, and child health and survival. Detailed methods and data sources have been described previously.Increasingly, Countdown is attempting to capture subnational data, although these data are dicult to ascertain in view of the sampling frames for national surveys that are based on Demographic and Health Surveys and Multiple Indicator Cluster Surveys.The unit of analysis is the country; the statistics of interest are nationally representative estimates of intervention coverage generated either through house-hold surveys or combinations of programme and survey data reported through relevant UN agencies and subjected to supplementary independent quality reviews by technical reference groups and Countdown members. Denominators are intervention specic; for example, interventions that eectively prevent or treat malaria are measured only in the 37 Countdown countries endemic for malaria, and prevention of mothertransmission of HIV coverage is assessed only in countries where this prevention is recommended for delivery to all pregnant women (all countries in subSaharan Africa and selected other countries on the basis of HIV seroprevalence estimates). In 2008, Countdown reported on data available up to 2006; since then, new rounds of both Demographic and Health Surveys and Multiple Indicator Cluster Surveys have been undertaken, in addition to national surveys focusing on malaria, nutrition, and other diseasespecic programmes. New datasets that are available for analysis have been included To assess withincountry disparities in coverage indicators, Countdown analyses include systematic breakdowns of 16 key coverage indicators by wealth quintiles. Equity indicators are summarised as a coverage index consisting of an unweighted average of four intervention areas across the continuum of care. Every area includes several selected indicators: family planning (need for family planning satised), maternal and newborn health (at least one antenatal visit and skilled attendant at delivery), immunisations (measles, BCG, and diphtheria, pertussis, and tetanus), and curative child care (diarrhoea and pneumonia management including oral rehydration and continued feeding and care seeking for pneumonia). The coverage gap, which is calculated as 100% minus the mean coverage index, provides an estimate of the increase needed to achieve universal coverage with all eight interventions for each wealth quintile. Coverage indices are also graphically represented as oating bars showing the range of coverage for selected indicators by wealth quintiles. Additional disparity analyses according to maternal education, sex of the child, urban or rural Health policy and systems indicators are tracked through databases available in the public domain (eg, Global Atlas of the Health Workforce and the WHO Statistical Information System) and through adquestionnaires administered to countries by WHO. The nancing indicators included an assessment of overseas For more on Health Surveys see http://www.For more on Cluster Surveys see http://www. Postnatal Postnatal visit for babies born outside PakistanZimbabweDHS=Demographic and Health Survey. NFHS=National Family Health Surveys. Survey.*Percentageyearswho reported a postnatal care visit within 2 days of delivery of their last child. †PercentagereceiveddaysTable : Coverage for postnatal visits for mothers and babies in Countdown countries with available data For additional disparity analyses For more on Global Atlas of the Health Workforceapps.who.int/globalatlas/For more on WHO Statistical www.who.int/whosis/en/ Review www.thelancet.comVol 375 June 5, 2010 For more on the Inter-agency Group on Child Mortality see http://www.childdevelopment assistance (ODA) in addition to patterns of national spending on maternal, newborn, and child health. The indicators that we present include an analysis of the maternal, newborn, and child health components of ODA on the basis of data reported by the Organisation for Economic Cooperation and Development. This analysis has been published in previous Countdown and has been updated with 2007 data. External nancing for family planning is reported on the basis of resource tracking estimates from the UN Population Fund. Future Countdown reports will update ODA gures to 2008, include family planning with maternal, newborn, and child health data, and provide ndings from new analyses of domestic health expenditures and national nancing gaps to achieve full coverage of interventions. The full Countdown account of progress for the 2010–11 cycle will be prepared in 2011. In this report, we summarise salient aspects of progress and Table 1 summarises progress towards achievement of MDG 4 targets in the 68 Countdown priority countries. Consistent with other recent ndings, the Interagency Group on Child Mortality Estimation data show progress in reduction of child mortality, although distributed unevenly between countries. The global mortality rate in children younger than 5 years fell by 28%, from an estimated 90 deaths per 1000 livebirths in 1990, to 65 deaths per 1000 livebirths in 2008. On the basis of these estimates, the absolute number of child deaths decreased to an estimated 8·8 million in 2008, from 12·5 million in 1990, which was the baseline year for the The new estimates suggest that the average rate of reduction between 2000 and 2008 was 2·3%, compared Progress in neonatal mortality (rst 28 days) remains slow, and in Africa almost no change was recorded.Neonatal deaths now account for 41% of deaths in children younger than 5 years, and this mortality is linked closely to slow progress in reduction of maternal mortality. Six of the 68 countries with high rates of mortality in children younger than 5 years (40 or more deaths per 1000 livebirths) have consistently achieved yearly rates of reduction of 4·5% or higher (Nepal, Bangladesh, Eritrea, Laos, Bolivia, and Malawi).Impressive gains in child survival have been made in several countries that are not yet classied as on track to meet the MDG 4 goal. For example, Niger, Mozambique, and Ethiopia have all reduced mortality in children younger than 5 years by more than 100 per 1000 livebirths since 1990, and altogether 19 countries are on track to achieve their MDG 4 targets. Although progress has been made in many countries, the rate of improvement worldwide is still insucient to reach MDG 4 targets, and in many countries progress remains Progress towards achievement of MDG 5 has been slow. Institute for Health Metrics and Evaluation estimates of maternal mortality suggest that 342900 (uncertainty interval 302100–394300) maternal deaths occurred worldwide in 2008, and that more than 50% of these deaths occurred in six countries (India, Nigeria, Pakistan, Afghanistan, Ethiopia, and the Democratic Republic of the Congo). Although the estimated number of deaths diers from 2005 WHO/UN estimates, the rate of reduction diers less strikingly. Estimates suggest that global progress between 1990 and 2005 was a reduction of 0·8% per year, which is similar to the WHO/UN estimates of 0·5% per year for the same period, and between 1990 and 2008 this reduction was 1·3% per year. Updated estimates of maternal mortality will become available in 2010, after a broad methodological review by the UN Interagency Committee for Mortality.Notwithstanding specic mortality estimates, coverage indicators for maternal health interventions such as skilled birth attendance, antenatal care, unmet need for contraception, and contraceptive prevalence rate show that much needs to be done to reach targets A and B for MDG 5. Reduction of maternal mortality and the estimated 20 million pregnancyrelated disabilities per year will necessitate concentrated eorts to improve coverage of comprehensive family planning programmes 10TL_2725_3Editor LBAuthor: XxxxxIllustrator: J HigginbottomDate: 12/05/10YNURGENT?Text typedImage redrawnChecked by: Prevalence (%) ChadEritreSierra LeoneMaliGuineaTurkmenistanMoroccMexicPeruChin 02028%233%80%82%82%91%101%100%120%81%23%270%276%312%212%618%630%709%713%869%406080100 Number of Unweighted countries medianContraceptive prevalence rate 66 306Unmet need for family planning 49 244Summary for all Countdown countrie Figure : Unmet need for family planning in Countdown countries with the highest and lowest contraceptive Review www.thelancet.comVol 375 June 5, 2010 and antenatal, delivery, emergency obstetric, and post-partum care—all indicators that are tracked by Count-down. Although data for access and coverage are not available, increased access to safe abortion care in countries where abortion is legal could also reduce maternal deaths. Coverage of skilled attendance at birth is often used to track progress towards MDG 5 target A, and is a sensitive measure of healthsystem strength. Tracking of coverage of caesarean sections, especially in rural areas, is also important for assessment of access to emergency obstetric care. Rates lower than 5% signal restricted access to care and are a marker of humanresource and other systems challenges. 33 of 51 Countdown countries with data obtained since 2000 reported rural coverage rates lower than 5%, and four countries had rural rates of less than 1% (Burkina Faso, Chad, Ethiopia, and Niger).Figure 2 shows median coverage for 20 Countdown interventions for which the target rate is universal coverage. Interventions are presented along the con-tinuum of care from prepregnancy to early childhood, and show highly variable results. Median coverage is high for vaccinations, vitamin A (two doses in the preceding 12 months), and other interventions than can be delivered vertically and at prescheduled times, and low for interventions that have to be delivered on demand, such as treatment for childhood illness and caesarean sections (table 2). There are gaps between the proportions of women in contact with health services for antenatal care or assistance at birth and the receipt of interventions that can and should be delivered during or in association with those contacts, such as intermittent preventive treatment for malaria and prevention of mother Early initiation ofbreastfeedin(59 countries)ExclusivebreastfeedinDjibouti(2006)Rwanda(2005)CAR (1994, 2006Senegal (1993, 2005)Lesotho (1996, 2004Pakistan (1995, 2007)Mali (1996, 2006)Benin (1996, 2006Guinea (1999, 2008)Togo (1998, 2008)Cambodia (2000, 2005)Zambia (1996, 2007Ghana (1993, 2008Madagascar (1992, 2004Burkina Faso,Cameroon(2006)Eritrea(2002)00204060801003%23%6%8%101112197%38%10166%34%36%37%38%43%48%48%60%6163%67Median national average (%)Infants exclusively breastfed (%)1020405060708090100 A B Figure : Median national coverage for breastfeeding practices in Countdown countries and rates in countries with the largest gains since 1990coverage2000;lowestcoveragePercentageyoungerwereexclusively(November,Surveys,Surveys,surveys.Republic.For the UNICEF Global Databasesee http://www.childinfo.org TurkmenistanChinAzerbaijanTajikistaIraqEgypIndonesiaBeniPeruSwazilanZimbabweBoliviaCameroonPhilippinesTogoMauritaniaCôte d’IvoireThe GambiaGhanBurkina FasoMalawCentral African RepublicPapua New GuineRwandaMaliAngolaIndiZambiaGuineaLiberiaSierra LeoneUgandaGuinea-BissauNigeriaPakistanNigerSomaliaHaitiLaosNepalBangladeshDR Congo020Livebirths attended byskilled personnel (%)4060801002008 median=54Around 2000Around 2008 Figure : Proportion of livebirths attended by skilled personnel in 34 Countdown countries with nationally representative measurements around 2000 and around 2008Coveragesurveyyear,years.Republic Review www.thelancet.comVol 375 June 5, 2010 transmission of HIV, when appropriate. Interventions conrmed as eective and promoted only recently, such as insecticidetreated bednets to prevent malaria, have low median coverage, but have made rapid gains in individual countries. Countdown draws attention to data gaps that need to be addressed to allow countries to make informed decisions about how to accelerate progress towards MDGs 4 and 5. For example, only 23 Countdown countries have access to data for postnatal care in women and only six have data for postnatal care in neonates (table 3). Additionally, several crucial interventions are not yet tracked by Countdown (eg, kangaroo mother care) because coverage data are not yet available, although eorts are underway to include coverage questions on these interventions in nationally representative Countdown focuses on individual countries and tries to limit crossnational aggregation, which masks high variation in coverage between and within countries along the continuum of care. We present coverage results for several individual interventions, showing wide variability between countries and drawing attention to the need for targeted eorts and assistance. For example, gure 3 shows the most recent estimates of contraceptive prevalence and unmet need for family planning in the ve countries with the highest and lowest contraceptive prevalence rates. Unmet need exceeds contraceptive prevalence rate in all ve countries with the lowest coverage. The wide disparity between these two groups of countries represents a gap that needs to be lled if the eectiveness of family planning for reduction of maternal mortality is to be realised in all Countdown countries.Figure 4 shows similar disparities between countries for the presence of a skilled attendant at birth; notably, many countries have made substantial progress, although overall rates remain unacceptably low in most regions. Burkina Faso, Pakistan, and Rwanda had gains of more than 20% from around 2000 to around 2008, whereas 11 countries showed no progress or decreases in coverage during this time. Figure 5 shows median national coverage rates for breastfeeding practices and the range of coverage across the 68 Countdown countries. Early and exclusive breastfeeding are major contributors to child survival, but rates are currently very low in many countries. The gure does show, however, 12 countries that have made gains of at least 20% since 1990 in the proportion of infants exclusively breastfed. Viewed together, gures 5 and 6 draw 10TL_2725_6Editor LBAuthor: XxxxxIllustrator: J HigginbottomDate: 12/05/10YNURGENT?Text typedImage redrawnChecked by: Median percentage of children reported to have received treatment (%)DiarrhoeaPneumoniaORT59 countriesPhilippines(2003)Korea(2004)Iraq(2006)Haiti(2005–06)Chad(2004)Botswana (2000)Somalia (2006)Care seeking64 countriesAntibiotic treatmen35 countries 100 020406042%48%27%80 Figure : Median proportion of children with suspected illness in previous 2 weeks who received treatment, in Countdown countries with most recent Estimatesofantibiotictreatmentdonotincludetreatmentofneonatalsepsis.Oralrehydration therapy (ORT) includes oral rehydration solutionand/or recommended homemade�uidsorincreased�uids,andcontinuedfeeding.Errorbarsshowthelowest and highest coverage estimates in Countdown countries since 2000. 10TL_2725_7Editor LBAuthor: XxxxxIllustrator: J HigginbottomDate: 12/05/10YNURGENT?Text typedImage redrawnChecked by: Mean coverage index (%) ZimbabweZambiaUgandaTanzaniaSwazilandSouth Africa 020406080100NepalMoroccoMaliMadagascarLiberiaLesothoKenyaIndonesiHaitiGuineaGuatemalaGhanaGabonEthiopiaEgyptDR CongoCongo (Brazzaville)ChadCambodiaBrazilBoliviaBeninBangladeshAzerbaijanPakistanNigeriaNigerSenagalRwandaPhilippinesPeruSierra Leone Poorest Richest Figure : Mean coverage index of eight reproductive, maternal, newborn, and child interventions in the poorest and richest quintiles of 38 Countdown countries with a Demographic and Health Survey, by countryvaccination,pertussis, and tetanus vaccination, BCG vaccination, oral rehydration and continued feeding, care seeking for Republic Review www.thelancet.comVol 375 June 5, 2010 attention to the inadequacies of use of measures of central tendency in guidance of national priorities and development assistance. They also show that rapid progress is possible. Figure 6 is a nal example showing unacceptably low rates of correct treatment for diarrhoea and pneumonia, which together account for more than one in three deaths in children younger than 5 years worldwide. Prevalence of correct treatment for childhood malaria is also very low, with a median rate of 30% on the basis of the most recent national estimates since 2000. Even this low rate is greatly reduced when coverage is assessed only for eective treatment with artemisininImprovement of equity and access to careCountdown proles include updated information about equity for 38 countries with a Demographic and Health Survey. In gure 7, mean coverage indices for the poorest and richest quintiles are shown as a oating bar for every country with a Demographic and Health Survey. As has been reported previously, in all countries analysed intervention coverage is substantially higher in mothers and children from rich families than in those from poor families. Notably, in groups of countries with similar overall coverage, inequity can vary substantially. For example, both Guatemala and Zambia have an overall coverage index of 59%, but in Guatemala, mothers and children from the poorest quintile have 38% coverage, whereas in Zambia this coverage is 55%, pointing to widely dierent patterns of inequality in access to services. Countries with small gaps between rich and poor groups, such as Bangladesh, Brazil, Egypt, Swaziland, and Zambia, merit indepth study to Degree of inequality varies with type of intervention. Among the interventions shown in gure 8, disparities are greater for maternal and newborn interventions than for those delivered to older children. Disparities in 10TL_2725_8Editor LBAuthor: XxxxxIllustrator: J HigginbottomDate: 11/05/10YNURGENT?Text typedImage redrawnChecked by: Average coverage (%) 020406080100ORT and continued feedingCare seeking for pneumoniVitamin A administration (child)BCG vaccineMeasles vaccinDPT3 vaccineInsecticide-treated net use (child)Postnatal visitEarly initiation of breastfeedingSkilled attendant at deliveryAntenatal care (7 visits)Family planning needs satised Poorest Richest Figure : Average coverage levels of selected reproductive, maternal, newborn, and child interventions in the poorest and richest wealth quintiles of 38 Countdown countries with a Demographic and Health Survey and available data, by intervention Postnatal care indicator refers to rehydrationtherapy.DTP3=diphtheria, Panel : Brazil’s success in narrowing the gapBrazil is one of the Countdown countries that are on target to reach the Millennium Development Goals (MDGs) related to childhealthandnutrition.Inchildrenyoungerthanyears,byyearyearlyneeded to reach the MDG target. Currently, 22 of every 1000childrendiebeforetheir�fthbirthday.Underweightprevalence in children younger than 5 years dropped from 5·7% in 1990, to 1·7% in 2006, and stunting fell from Overallbybetweensocioeconomicquintiles(�gure9).In1996,about30%ofallreceiveby2007,coverageuniversal.Likewise,prevalence fell from 40% to 10% in children in the poorest between2007,3–5% in the richest quintile. These examples are only two of reproductive,health for which equity has improved in the past two decades.Brazil’simprovedyears.tax-basedUnied Health System without any user fees was launched in 1989, and geographical targeting has guided deployment of family health teams of doctors, nurses, and community health workers in the poorest areas of the country. As a result, primary health-care coverage is now almost universal, as shown in the example of skilled delivery. Additionally, coverthe population, and several health sector initiatives—activities—havePerhapsmore than any one policy or initiative, the reduction of regional and socioeconomic disparities in health and developmentBrazil’sagenda for the past 20 years, and this approach is now Narrowing of sex dierentials in BangladeshHistorically,boyswerelikelyreceivelife-saving interventions than were girls. Such a pattern is common in south Asian countries. However, gure 10 shows that sex disparities in measles vaccine coverage have eectively disappeared in Bangladesh in the past decade. initiative,initiativesempowermentwomen (microcredit, women’s groups, female education) coupled with increased access to health care, particularly through community workers, might account for these showedworkersinequities in immunisation coverage. Review www.thelancet.comVol 375 June 5, 2010 interventions that are most frequently delivered in xed health facilities (eg, antenatal or delivery care) tend to show greater disparities than do those delivered in the com-munity (eg, vaccines, vitamin A, or insecticidetreated bednets). Family planning interventions, which can be delivered in facilities, in the community, or in both settings, fall in between these two groups in terms of inequalities. Early initiation of breastfeeding shows remarkably small disparities—possibly because this intervention is largely dependent on longstanding cultural practices and is yet to be aected by promotion eorts. The Countdown tracking process for inequities also provides examples of how countries have reduced disparities in key interventions by targeting of and improvement of access. Panel 2 provides information about trends and correlates of equitable access to key interventions in Brazil (gure 9) and Bangladesh (gure 10). The role of health systemsStrengthening of health systems is crucial for eective delivery of reproductive, maternal, newborn, and child health care across phases of life and places of caregiving. In addition to coverage of key interventions, Countdown also tracks indicators of progress in strengthening of the main building blocks of health systems. Acute shortages and poor distribution of human resources continue to negatively aect the performance of health systems in many countries. Only 22% of the 68 Countdown countries met the minimum threshold of 23 physicians, nurses, and midwives per 10000 people that was established by WHO as necessary to deliver essential health services. The shortage of personnel is compounded by uneven geographical distribution within countries, including between urban and rural areas. In the subsample of countries with disaggregated the median density is four times higher in urban areas than in rural areas, with important implications for equitable delivery of services. Countries are increasingly addressing shortages of highly skilled personnel through scaleup of production and appropriate task sharing. For example, in 2010, 29 countries had a policy allowing communitybased health workers to manage pneumonia with antibiotics, compared with 18 countries in 2008. Increased investment in education and training of health workers, strategies motivating health workers to remain where they are most needed, and eective regulatory frameworks including processes for skills substitution remain priorities for workforce governance, policy, and management. Crucial evidence to support decision making for the roles, training, and deployment of community health workers, for example, is now falling Countdown countries are adopting evidencebased policies and investing in equipment, medical supplies, and infrastructure, but further progress is needed. Figure 11 summarises the number of countries that have adopted specic policies to increase access to and quality of care. Implementation of new policy guidelines for management of diarrhoea with zinc accelerated as production of zinc tablets increased—UNICEF’s procurement alone rose by seven times from 20·5 million tablets in 2006, to 158 million in 2008. Conversely, availability of emergency obstetric care is alarmingly low, with data for twothirds of 30 countries showing availability of less than 50% of the required minimum Figure name: 10TL_2725_9Editor: Laura BenhamAuthor: of illustrator: Sean CarneyDate started: 11/05/2010YNURGENT?Text typedImage redrawnChecked by: 19891992007403020100Poorest2ndIncome quintile3rd4thRichestPrevalence of stunting (%) B 7008090100Coverage of skilled attendants at birth (%1992007 A Figure : Coverage of skilled attendants at birth (A) and prevalence of stunting in children younger than 5 years (B) in national surveys, by quintiles of family income in Brazil, 1989–2007 Figure name: 10TL_2725_10Editor: Laura BenhamAuthor: Name of illustrator: Sean Carney & JH Date started: 12/05/2010YNURGENT?Text typedImage redrawnChecked by: 708060 019931996199Year of survey2004200790100Measles vaccine coverage (%)BoysGirl Figure : Measles vaccine coverage in Bangladesh, 1993–2007 Review www.thelancet.comVol 375 June 5, 2010 Reliable and timely evidence and information, including vital registration and death audits to improve quality of care, are necessary for eective stewardship of health systems. Countdown data showed that only a third of countries implemented a policy on maternal deaths notication and audit, and the proportion of babies registered at birth in the vital registration system was less than 70% in 38 countries. These ndings emphasise the need to strengthen all healthsystem functions if ecient and sustainable improvements in coverage of interventions are to be made. This process will need a balance between investment in interventions to tackle specic health issues and investment to address general systemic bottlenecks to service delivery. For many key elements of healthsystems performance, such as governance, availability of commodities and diagnostics, and costs for services, there are key gaps in available information and monitoring systems. Countdown will continue to track policy and system indicators that reect both recognised and innovative evidencebased approaches to meet both objectives. Attention will also be directed to assessment of progress in service integration across various levels of care Resources remain a crucial gap, and both overall and countries. The median per head total health expenditure in 68 countries is a mere 80 international dollars (2007); only ve Countdown countries are devoting 15% or more of their national budgets to health, and only ve countries have household outpocket expenditures of less than The goal is to move away from outpayments through several approaches including Total ODA for maternal, newborn, and child health in 2007 (in 2005 dollars) was US$4·1 billion, which was a 16% increase from 2006, and almost double the amount of aid in 2003 in inationadjusted terms (US$2·1 billion). Although these data show improved commitment to maternal, newborn, and child health, funding for this sector only accounted for 31% of all ODA for health in 2007 and, as shown in earlier analyses, this funding is often not well targeted to countries with the greatest need. Our ndings also show that ODA for family planning has slightly fallen in real terms, continuing a steeper longerterm decline that started in the mid1990s. This reduction has been concurrent with increases in ODA for other maternal, newborn, and child health components of a comprehensive reproductive health approach. This pattern might represent some degree of replacement, with funds targeted to family planning being rerouted to other maternal, newborn, and child health interventions—especially because some of the interventions are Accurate reporting by donors and attribution to specic service areas are also dicult with available data sources. To the extent that these factors contribute, some of the increase in ODA for maternal, newborn, and child health might not be additional funding, but rather include some funds that would have gone to or been attributed to family planning. Improved analysis of synergies in outcomes is also needed, since well resourced reproductive and maternal health services result in similar improvements in maternal, newborn, and child survival, as well as other benets. Indepth analyses of these questions are underway and will be reported in 2011. Recent analysis has raised some concerns about the degree to which external aid ows might inhibit additional domestic ows to health.Work in progress by the Countdown for 2011 will include new data for domestic resource ows for maternal, newborn, and child health and family planning, which are an important source of support for In the 2 years since the last Countdown report, 19 million women of childbearing age and children younger than 5 years have died because of preventable disorders.Pneumonia, diarrhoea, and malaria still kill more than 3 million children every year, and our report shows that the longestablished treatments for these infections still do not reach half of the children who need them. Newborn survival remains a challenge and demonstrable change might need a mix of strategies addressing maternal health and nutrition as well as improvements in delivery of postnatal and other targeted primary care services. China’s successful reduction of newborn and child mortality during the past two decades is a remarkable example of progress through steady 10TL_2725_11Editor LB XxxxxIllustrator: J HigginbottomDate: 12/05/10YNURGENT?Text typedImage redrawnChecked by: Number of Countdown countries adopting policy 60 50 0102030129432946412622InternationalCode of Marketing of Breastmilk Substitutes enactedMaternityprotection inaccordancewith ILOConvention18Specicnoticationof maternaldeathsMidwivesauthorisedto administercore set oflifesavinginterventionsIMCIadaptedto coverneonatesaged 0–weeksCommunitytreatment ofpneumoniaNew ORSformulaand zinc formanagementof diarrhoeaCostedimplementationplan(s) fomaternal,newborn, andchild healtavailable40 Figure : Status for adoption of evidence-based policies related to maternal, newborn, and child health in 68 Countdown countriesILO=Internationalrehydration Review www.thelancet.comVol 375 June 5, 2010 For more on see http://www.investments in reproductive health, primary care, and Progress remains mixed for MDGs 4 and 5—some countries are on track to meet MDG 4 and many others have reported accelerating progress in the past decade, whereas in a few countries progress has decelerated. Recent and upcoming data are likely to show an improved rate of reduction in maternal mortality ratios compared with previous UN estimates, but much increased progress is needed if MDG 5 is to be achieved. Inadequate progress in reduction of maternal deaths is closely linked to inadequate reduction of newborn deaths, underscoring the link between MDGs 4 and 5. Our ndings show that although coverage of skilled delivery care increased in 12 countries, others had little or no improvement. Similarly, wide variation across and within the 68 countries in coverage of other maternal interventions and service contact points including antenatal, emergency obstetric, and postnatal care is evidence of uneven progress in delivery of services to women in need. The inclusion of target B on universal access to reproductive health in MDG 5 in 2008 was a crucial acknowledgment of the importance of comprehensive family planning for prevention of unplanned pregnancies (including in adolescents) and improvement of maternal health. The low contraceptive prevalence rate, inequitable distribution of family planning services, and high unmet need in many Countdown countries show that increased Notwithstanding the limitations of health systems in provision of maternal health services such as family planning, skilled delivery, and emergency obstetric care, social determinants also act as an important barrier to universal coverage. Families need access to rapid transportation to functional facilities when danger signs occur during labour, delivery, and the immediate postpartum period. Increased education of women, improved sex equality, comprehensive family planning services so that women can space or limit births, and strengthening of women’s empowerment in decision making about seeking care are essential elements of strategies to improve maternal health and to reduce neonatal and child deaths. Analyses are also needed to improve understanding of the interactions between age at pregnancy, parity, and spacing between births and Countdown remains committed to improving availability and use of data for eective healthstewardship. Timely and reliable information is necessary to inform adoption of appropriate policies and achieve optimum return of investment in health systems, and to drive change in countries towards equitable coverage of key interventions for maternal, newborn, and child survival. In the 5 years since the rst Countdown report, much consensus has been reached among academics, public health experts, UN agencies, nonorganisations, healthcare professional associations, and policy makers to focus on use of data to prioritise interventions that have the greatest potential to bring about tangible change. Indicators and data sources have diversied in response to Countdown’s adoption of the continuum of care approach and as new evidence emerges about eective strategies to improve maternal, newborn, and child health and survival. Eorts have been made to include additional sensitive markers of maternal and child undernutrition, newborn care, and infant and young child feeding as well as family planning. Focus has increased on the determinants of coverage, including policy and health systems, nancial ows, inequities, and social determinants, in addition to increased recognition of the need for crosscutting analysis to understand what lies behind the numbers. The 2011 Countdown report will provide increased detail and updated estimates of coverage for all Countdown interventions, and indepth analyses of coverage determinants and characteristics of countries that have ZAB, JB, and JR wrote the rst draft of this report with inputs from lead authors from all working groups (coverage, equity, health systems, Conicts of interestWe declare that we have no conicts of interest.This report was funded by the Bill & Melinda Gates Foundation, UK Department for International Development, Government of Norway, Partnership for Maternal, Newborn and Child Health, Save the Children USA and UK, UNICEF, United Nations Population Fund, and WHO. We thank Holly Newby and Archana Dwivedi from UNICEF for their work in helping to construct the Countdown databases, Julia David from the Johns Hopkins University for her help with the initial review and analysis, Stan Bernstein and Edilberto Loaiza from the UN Population Fund for their inputs on the family planning indicators and analyses, Aluisio Barros for his work on the equity analyses, and Nancy Terreri for her review of the data. We also thank all members of the ve Countdown working groups that have contributed to the conceptualisation of the Countdown 2010 report and products and all individuals that have contributed to data collection, tabulation, and analysis. Details about Countdown membership are provided on the Countdown website. The authors alone are responsible for the views expressed in this publication and they do not necessarily represent the References UN. The Millennium Development Goals report 2009. New York, NY, USA: United Nations Department of Economic and Social The Countdown Core Group. Tracking progress in child survival: the 2005 report. New York, NY, USA: The United Nations Children’s Fund, 2005. http://www.countdown2015mnch.org/reportspublications/2005report (accessed May 16, 2010).Countdown Coverage Writing Group, on behalf of the Countdown to 2015 Core Group. Countdown to 2015 for maternal, newborn, The Countdown to 2015: maternal, newborn and child survival. Tracking progress in maternal, newborn and child health: the 2008 report. http://www.countdown2015mnch.org/reportspublications/2008report (accessed May 16, 2010).Countdown to 2015: maternal, newborn and child survival. Country proles. http://www.countdown2015mnch.org/reportsproles (accessed May 16, 2010). Review www.thelancet.comVol 375 June 5, 2010Aid Harmonization and Aligment. Paris Declaration on Aid Eectiveness. Paris, France, March 2, 2005. http://www.editable?key=205 (accessed May 16, 2010).Monitoring and evaluation working group of the International Health Partnership and Related Initiatives. Monitoring performance proposed common framework. Geneva, Switzerland, April, 2008. http://www.internationalhealthpartnership.net//CMS_les/May 16, 2010).Boerma T, AbouZahr C, Bos E, Hanswen P, Addai E, LowMonitoring and evaluation of health systems strengthening: an operational framework. Geneva, Switzerland, November, 2009. http://www.internationalhealthpartnership.net//CMS_les/May 16, 2010).D de Savigny, T Adam, eds. Systems thinking for health systems strengthening. Geneva, Switzerland; World Health Organization, 2009. http://www.who.int/pmnch/topics/health_systems/20091117_(accessed May 16, 2010).Commission on Social Determinants of Health. Closing the gap in of health. Geneva, Switzerland: World Health Organization, 2008. http://www.who.int/social_determinants/thecommission/nalreport/en/index.html (accessed May 16, 2010).Bryce J, Terreri N, Victora CG, et al. Countdown to 2015: tracking Countdown 2008 Equity Analysis Group. Mind the gap: equity and in 54 Countdown countries. 1259–67.Rajaratnam JK, Marcus JR, Flaxman A, et al. Neonatal, 1970–2010: a systematic analysis of progress towards Millennium Development Goal 4. You D, Wardlaw T, Salama P, Jones G. Levels and trends in 5 mortality, 1990–2008. review. 2007. http://www.unicef.org/progressforchildren/2007n6/index_41854.htm (accessed Jan 4, 2008).Victora CG, de Onis M, Hallal PC, Blössner M, Shrimpton R. Worldwide timing of growth faltering: revisiting implications for Pediatrics UNICEF. The state of the world’s children, special edition. Statistical tables. New York, NY, USA: UNICEF, 2009.Hogan MC, Foreman KJ, Naghavi M, et al. Maternal mortality for Millennium Development Goal 5. Monteiro CA, Benicio MHD, Conde WL, et al. Narrowing experience, 1974–2007. Bull World Health OrganBishai D, Suzuki E, McQuestion M, Chakraborty J, Koenig M. The Health Policy Planhealth. Geneva, Switzerland: World Health Organization, 2006. http://www.who.int/whr/2006/en/ (accessed May 16, 2010).Bhutta ZA, Lassi ZS, Pariyo G, Huicho L. Global experience of Millennium Development Goals: a systematic review, country case studies, and recommendations for scaling up. Geneva, Switzerland: Global Health Workforce Alliance, 2010.Lewin S, MunabiWHO. World health statistics, 2010. Geneva, Switzerland: World Health Organization, 2010. count. Geneva, Switzerland: World Health Organization, 2005. http://www.who.int/whr/2005/en/ (accessed May 16, 2010).Lu C, Schneider MT, Gubbins P, LeachKemon K, Jamison D, Murray CJL. Public nancing of health in developing countries: 1375–87.27Rudan I, Chan KY, Zhang JS, et al, on behalf of WHO/UNICEF’s Child Health Epidemiology Reference Group (CHERG). Causes of deaths in children younger than 5 years in China in 2008. Bhutta ZA. Unravelling the enigma of health statistics in China. Rutstein SO. Eects of preceding birth intervals on neonatal, infant Int J Gynecol Obstet