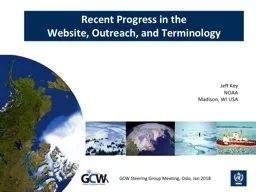
/
GCW Steering Group Meeting, Oslo, Jan 2018 GCW Steering Group Meeting, Oslo, Jan 2018

GCW Steering Group Meeting, Oslo, Jan 2018 - PowerPoint Presentation

broadcastworld
broadcastworld . @broadcastworld
Follow
343 views
Uploaded On 2020-07-03

GCW Steering Group Meeting, Oslo, Jan 2018 - PPT Presentation

1 Recent Progress in the Website Outreach and Terminology Jeff Key NOAA Madison WI USA Working Groups and Teams Terminology Online glossary GCW has a compilation of cryosphere terms from a variety of sources including WMO UNESCO National Snow and Ice Data Center NSIDC Antarctic ID: 794098

ice gcw noaa offered gcw ice offered noaa cimss tracker website cryosphere snow added nipr products jaxa assessments permission

Share:

Link:

Embed:

Download Presentation from below link

Download The PPT/PDF document "GCW Steering Group Meeting, Oslo, Jan 20..." is the property of its rightful owner. Permission is granted to download and print the materials on this web site for personal, non-commercial use only, and to display it on your personal computer provided you do not modify the materials and that you retain all copyright notices contained in the materials. By downloading content from our website, you accept the terms of this agreement.


Presentation Transcript

Slide1

GCW Steering Group Meeting, Oslo, Jan 2018

1

Recent Progress in the

Website, Outreach, and Terminology

Jeff Key

NOAA

Madison, WI USA

Slide2

Working Groups and Teams

Slide3

TerminologyOnline glossary: GCW has a compilation of cryosphere terms from a variety of sources, including WMO, UNESCO, National Snow and Ice Data Center (NSIDC), Antarctic Sea Ice Processes and Climate (

ASPeCt), ECCC, NOAA, USGS, IPCC, IPA, BoM, and others.

Recent Progress: Six more sources have been added with 1282 additional terms. There are 4141 entries from 26 sources; over 2200 are unique. Terms have been added into the crowdsourced metadictionary

YAMZ.The glossary is currently being evaluated under contract. GCW definitions of recommended variables are being created.

Slide4

Website

The website differs from the METNO GCW data portal in that it contains more dynamic information (news, state of the cryosphere plots, highlights, calendar), as well as background, higher-level information, GCW documents, and outreach material. It links to the METNO data portal.

globalcryospherewatch.org

Slide5

Recent Progress: Website and Outreach

WebsiteA new Cryosphere Trends web page has been added. All assessments have been updated. Cryosphere in the News items are now archived

and will be available back to July 2017 (approx) forever.CryoNet recommended variables lists have been added.New sea ice trackers from JAXA and NOAA/CIMSS have been added. Regional sea ice products for Alaska have been added.

Lots of small refinements and additions (added GCW timeline, data protocol, restructured measurement methods, added new stations, …)The logo has been updated (very minor).OutreachAdded an

Educational Resource page (needs more content).Some GCW handouts have been updated.

Slide6

CryoNet Recommended Variables Tables

Slide7

Handouts Updated May 2017

= updated

Slide8

New Assessments

Slide9

New Assessments: Cryosphere Trends

Slide10

Trackers(11 total; see Products slide)

Slide11

Website Statistics

Top Web Pages Visited (varies by month):

Surface network

Cryosphere in the News

Cryosphere Now

Glossary

Top Countries (hits from; varies by month):

Unresolved

28%

Network (.net)

26%

Commercial (.com)

20%

Spain

10%

Germany

2%

Educational (.edu)

2%

Italy

1.20%

Czech Republic

0.74%

UK

1%

Canada

0.64%

Slide12

Website Products

Product

SourceOffered or Approved

Trackers: 

 JAXA-NiPR Ice Extent Tracker

NiPROffered

JAXA-NiPR Ice Trend TrackerNiPR

Offered

APP-x Ice Thickness Tracker

NOAA/CIMSS

GCWAPP-x Temperature Tracker

NOAA/CIMSS

GCW

APP-x Surface Albedo Tracker

NOAA/CIMSS

GCW

GCW/FMI SWE Tracker

FMI

GCW

EC/GCW NH Snow Extent Tracker

ECCC (EC)

GCW

EC/GCW NH SWE Tracker

ECCC (EC)

GCW

Glacier Mass Balance (annual tracker)

WGMS

GCW

Alaska Permafrost (annual tracker)

Univ. Alaska-Fairbanks

Permission

Northern Hemisphere Thaw Depth

Univ. Zurich, Metno (?)

Offered

Assessments:


All annual time series plots in Assessments

Various sources, processed by NOAA/CIMSS

GCW

All assessments (snow, sea ice, etc.)

Written by NOAA/CIMSS

GCW

Product

Source

GCW, Offered, Permission

Daily or Monthly Plots (not trackers):


NOAA Multisensor Snow and Ice

NOAA

Permission

JAXA AMSR2 Snow and Ice

JAXA

Offered

SSM/I Ice Concentration

NOAA/CIMSS

Offered

VIIRS Ice Concentration

NOAA/CIMSS

Offered

VIIRS Ice Surface Temperature

NOAA/CIMSS

Offered

Cryosat Ice Thickness

ESA

Offered

SMOS Ice Thickness

ESA, Univ. Hamburg

Offered

JAXA-NiPR Ice Thickness

NiPR

Offered

JAXA-NiPR Ice Drift

NiPR

Offered

ASIP Alaska Ice Concentration (3 regional products)

NOAA Alaska Sea Ice Program

Offered

Argentina SH Ice Concentration Forecast

Argentine Naval Hydrographic Service

Offered

AARI/NIC/NMI ice (3)

AARI

Offered

EC Global Snow Cover

ECCC

Permission

IMS Snow Cover

National Ice Center

Permission

Rutgers snow extent and departure

Rutgers Univ.

Permission

CIMSS AMSR2 SWE

NOAA/CIMSS

Offered

Japan Snow Depth

NiPR

Offered

Daily atmosphere products

NOAA/CIMSS

Offered

Slide13

Plans, Possibilities, and NeedsPlans

Find a backup/future website location; run a parallel system.Wikipedia entryPossibilitiesRecreate global cryosphere map

. Would be a nice GCW product.GCW mobile appGCW newsletterAdd quality assurance CryoNet web pageNeedsMore contributors for assessments

Near real-time graphics for glaciers and permafrost in the SHMore educational resources, picture, videos

Slide14

Things are Coming Together

The real progress is that previously disconnected activities are coming together:

Terminology: Glossary compilation and CryoNet recommended variables efforts will result in a GCW glossary. This feeds into the development of metadata for the GCW Data Portal. Cryosphere Now products: The proportion of GCW products is increasing, and those posted on the website will eventually be

linked to entries the Data Portal. Portal visualization tools may be used for graphics on the website.