/
Sample Space Diagrams This Sample Space Diagrams This

Sample Space Diagrams This - PowerPoint Presentation

broadcastworld
broadcastworld . @broadcastworld
Follow
357 views
Uploaded On 2020-08-27

Sample Space Diagrams This - PPT Presentation

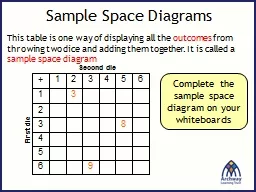
table is one way of displaying all the outcomes from throwing two dice and adding them together It is called a sample space diagram 9 6 5 4 8 3 2 3 1 6 5 4 3 2 1 Second die ID: 805646

space total dice sample total space sample dice die probability diagrams remainder number numbers fair game diagram score winsis

Share:

Link:

Embed:

Download Presentation from below link

Download The PPT/PDF document "Sample Space Diagrams This" is the property of its rightful owner. Permission is granted to download and print the materials on this web site for personal, non-commercial use only, and to display it on your personal computer provided you do not modify the materials and that you retain all copyright notices contained in the materials. By downloading content from our website, you accept the terms of this agreement.


Presentation Transcript

Slide1

Sample Space Diagrams

This table is one way of displaying all the outcomes from throwing two dice and adding them together. It is called a sample space diagram

9

6

5

4

8

3

2

3

1

6

5

4

3

2

1

+

Second die

First die

Complete the sample space diagram on your whiteboards

Slide2

12

1110

9

8

7

6

11

10

9

8

7

6

5

10

9

8

7

6

5

4

9

8

7

6

5

4

3

8

7

6

5

4

3

2

7

6

5

4

3

2

1

6

5

4

3

2

1

+

Second die

First die

12

11

10

9

8

7

11

10

9

8

7

6

10

9

8

7

6

5

9

8

7

6

5

4

8

7

6

5

4

3

7

6

5

4

3

2

The sample space diagram can be used to find probabilities.

What is the probability of getting a total more than 5?

What is the probability of getting a total less than 10?

What is the probability of getting a total that is a square number?

What is the probability of getting an even total?

What is the probability of getting an odd total?

What is the probability of getting a total less than 13?

Sample Space Diagrams

Slide3

(1)

(2)(3)(4)Two Dice Games: Use sample space diagrams to show how you decide whether the game is fair.two dice are rolled and the numbers on each dice are subtracted (smaller from larger) if the difference is 1 or 2: Anton winsif the difference is 0, 3, 4 or 5: Brisa winsis this a fair game?two dice are rolled and the numbers on each are multiplied and then this is divided by 5the score is the remaindere.g. for (1, 3) you get 3  5 the remainder is 3if the remainder is 0 or 1: Alice winsif the remainder is 2, 3 or 4: Bram winsis this a fair game?two dice are rolled and the numbers on each dice are added

if the total is prime: Adrian wins

if the total is composite (not prime): Bella winsis this a fair game?two dice are rolled and the numbers on each are multiplied and then this is divided by 3the score is the remaindere.g. for (2, 5) you get 10  3 the remainder is 1

if the remainder is 0: Alwyn winsif the remainder is 1 or 2: Bart winsis this a fair game?

Slide4

A coin and a ten sided die are thrown and the outcomes recorded in the two-way table below.

+12

3

4

5

67

89

10

H

2,H

7,H

T

8,T

Dice

Coin

Sample Space Diagrams

Complete the sample space diagram on your whiteboards

Slide5

A coin and a ten sided die are thrown and the outcomes recorded in the two-way table below.

Sample Space Diagrams

How many outcomes are there?

What is the probability of getting a head and an even number?What is the probability of getting a tail and a square number?+

12

3

45

67

8

910

H

1,H2,H

3,H4,H

5,H6,H

7,H

8,H9,H

10,HT

1,T2,T

3,T4,T

5,T6,T

7,T

8,T9,T

10,T

Die

Coin

Slide6

Sample Space Diagrams

Two four sided dice are thrown and the numbers added together.

What is the probability of getting:

a total more than 4?a total less than 8?a prime number total?a total that is at least 3? a total of 4 or 5?the same number on both dice?a lower number on the first dice?

8

7

6

5

4

7

6

5

4

3

6

5

4

3

2

5

4

3

2

1

4

3

2

1

+

Second die

First die

Complete the sample space diagram on your whiteboards

Slide7

Sample Space Diagrams

8

7

6

5

4

7

6

5

4

3

6

5

4

3

2

5

4

3

2

1

4

3

2

1

+

Second die

First die

4

4

3

4

3

Use the table to find the probability of getting a score of 3 or 4.

The probability of getting a score of 3 or 4 can be written as

P(3 or 4).

P(3 or 4) =

5

16

P(5 or 6) =

7

16

P(2 or 7) =

3

16

6

5

6

5

4

6

5

4

3

5

4

3

7

7

2

6

5

6

5

6

5

5

Slide8