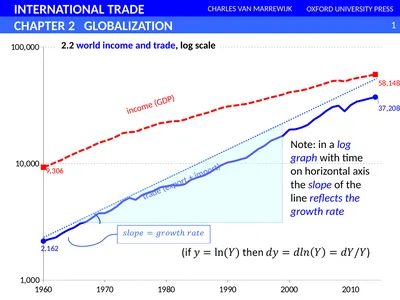
PPT-2.2 world income and trade, log scale income (GDP)
Author : calandra-battersby | Published Date : 2025-05-28
22 world income and trade log scale income GDP trade export import Note in a log graph with time on horizontal axis the slope of the line reflects the growth rate
Presentation Embed Code
Download Presentation
Download Presentation The PPT/PDF document "2.2 world income and trade, log scale in..." is the property of its rightful owner. Permission is granted to download and print the materials on this website for personal, non-commercial use only, and to display it on your personal computer provided you do not modify the materials and that you retain all copyright notices contained in the materials. By downloading content from our website, you accept the terms of this agreement.
2.2 world income and trade, log scale income (GDP): Transcript
22 world income and trade log scale income GDP trade export import Note in a log graph with time on horizontal axis the slope of the line reflects the growth rate 23b world trade and income growth 5year moving average . Macro-model scenarios. Francis Cripps. Alphametrics Co., Ltd.. Europe today and in coming years. Economic and financial issues in Europe today including low GDP growth, unemployment, government deficits and high levels of debt raise fundamental questions about institutions, priorities, standards and policy rules.. Calculating and Tracking GDP. Expenditure A. pproach. Determining GDP by adding up all the spending on final goods and . services.. Personal . Consumption Expenditures . (. C. ). Gross . Investment . The value of the output of goods and services produced in an economy over a period of time. Increases in National Income mean that the economy has grown – economic growth!. It is assumed that a . richer nation . Methodology. and Data. Data are . monthly. . frequency. : April 2010 – . December. 2013. Series. are GDP, M2, CPI, NEER, LABOR & OILP. Steps. :. Testing. . stationarity. Lag. . specification. Aggregate Expenditures. The total amount spent on final goods and services. . AE consists of (C) consumption + (. Ig. ) Gross Investment. . AE = C + . Ig. Equilibrium GDP. The level at which the total quantity of goods produced equals the total quantity purchased. . In . 1995 the Nominal GDP = $100 billion and Real GDP = $120 billion. Calculate the GDP deflator for this economy in 1995.. In. . 1995 the Nominal GDP = $100 billion and Real GDP = $120 billion. Calculate the GDP deflator for this economy in 1995.. What does it mean to globalize the Economy?. Comparative and Absolute Advantage. A country has an . absolute advantage. when it has the ability to produce more of a given product using a given amount of resources.. ECO41 International Economics. Udayan Roy. Based on . International Economics: Theory and Policy. , by Paul Krugman, Maurice Obstfeld, and Marc Melitz, Eleventh Edition, 2018. World Trade: An Overview. Chapter 15. McGraw-Hill/Irwin. Copyright © . 2015 . by . McGraw-Hill Education (Asia). . All rights reserved.. Learning Objectives. Explain how economists define and measure an economy's output. Apply the expenditure method for measuring GDP to analyze economic activity. Impacts of export lead growth in China. Poverty headcount ratio at $1.90/day (% of pop). 1990. 2014. 66.6%. 1.4%. Life expectancy at birth. 1968. 2016. 55.8 years. 76 years. Improved sanitation. 1990. Macroeconomics: Data and Issues. Learning Objectives. Explain how economist define and measure an economy's output. Use the expenditure method for measuring GDP to analyze economic activity. Define and compute nominal GDP and real GDP. The Gross Domestic Product (GDP) and National Accounting 2 GDP and National Accounting Chapter 7 Vocabulary Nominal Gross Domestic Product (GDP) Real GDP Intermediate goods Final goods Disposable income I recommend that you view it as one page by clicking on the open book icon at the bottom of the page.. 7a – Measuring . GDP. Define GDP. Problems with using GDP as a Measure of Social. Welfare (Standard of Living). Gross Domestic Product (GDP). “GDP is the market value of all final goods and services produces within a country in a given period of time”. Y = C + I + G + NX. Y = GDP. C – Consumption. I – Investment.
Download Document
Here is the link to download the presentation.
"2.2 world income and trade, log scale income (GDP)"The content belongs to its owner. You may download and print it for personal use, without modification, and keep all copyright notices. By downloading, you agree to these terms.
Related Documents