/
AD & AS Barnett AD & AS Barnett

AD & AS Barnett - PowerPoint Presentation

calandra-battersby
calandra-battersby . @calandra-battersby
Follow
343 views
Uploaded On 2019-12-28

AD & AS Barnett - PPT Presentation

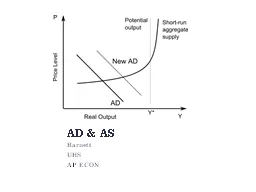
AD amp AS Barnett UHS AP ECON Introduction Over the long run real GDP grows about 3 per year on average In the short run GDP fluctuates around its trend Recessions periods of falling real incomes ID: 771660

curve sras rate increase sras curve increase rate lras run output policy shifts shift learning demand price interest long

Share:

Link:

Embed:

Download Presentation from below link

Download Presentation The PPT/PDF document "AD & AS Barnett" is the property of its rightful owner. Permission is granted to download and print the materials on this web site for personal, non-commercial use only, and to display it on your personal computer provided you do not modify the materials and that you retain all copyright notices contained in the materials. By downloading content from our website, you accept the terms of this agreement.


Presentation Transcript

AD & AS BarnettUHSAP ECON

Introduction Over the long run, real GDP grows about 3% per year on average. In the short run, GDP fluctuates around its trend. Recessions: periods of falling real incomes and rising unemploymentDepressions: severe recessions (very rare)Short-run economic fluctuations are often called business cycles. 0

Three Facts About Economic Fluctuations FACT 1 : Economic fluctuations are irregular and unpredictable. U.S. real GDP, billions of 2005 dollars The shaded bars are recessions

Three Facts About Economic Fluctuations FACT 2 : Most macroeconomic quantities fluctuate together. Investment spending, billions of 2005 dollars

Three Facts About Economic Fluctuations FACT 3 : As output falls, unemployment rises. Unemployment rate, percent of labor force

Classical Economics—A Recap Most economists believe classical theory describes the world in the long run, but not the short run. In the short run, changes in nominal variables (like the money supply or P ) can affect real variables (like Y or the u-rate). To study the short run, we use a new model. 0

The Model of Aggregate Demand and Aggregate Supply P Y AD SRAS P 1 Y 1 The price level Real GDP, the quantity of output The model determines the eq’m price level and eq’m output (real GDP). “Aggregate Demand” “Short-Run Aggregate Supply” 0

The Aggregate-Demand ( AD) Curve The AD curve shows the quantity of all g&s demanded in the economy at any given price level. P Y AD P 1 Y 1 P 2 Y 2 0

Why the AD Curve Slopes Downward Y = C + I + G + NXAssume G fixed by govt policy. To understand the slope of AD , must determine how a change in P affects C, I, and NX. P Y AD P 1 Y 1 P 2 Y 2 Y 1 0

The Wealth Effect ( P and C ) Suppose P rises. The dollars people hold (save) buy fewer g&s, so real wealth is lower.People feel poorer. Result: C falls. 0 P Y AD P 1 Y 1 P 2 Y 2

The Wealth Effect ( P and C ) Suppose P falls. More goods and services can be demanded with income savings (wealth). Purchasing power of wealth increases at a lower price levelResult: C increases. 0 P Y AD P 2 Y 1 P1 Y 2

The Interest-Rate Effect ( P and I ) Suppose P rises. Buying g&s requires more dollars. Demand for money increases. This drives up interest rates. Result: I (investment) falls. (Recall, I depends negatively on interest rates.) 0 P Y AD P 1 Y 1 P 2 Y 2

The Exchange-Rate Effect ( P and NX ) Suppose P rises. U.S. interest rates rise (the interest-rate effect).Foreign investors desire more U.S. bonds & currencyHigher demand for US $ in foreign exchange market.U.S. dollar appreciates. U.S. exports more expensive to people abroad, imports cheaper to U.S. residents. Result: NX falls. 0 P Y AD P 1 Y 1 P 2 Y 2

The Slope of the AD Curve: Summary An increase in P reduces the quantity of g&s demanded because: P Y AD P 1 Y 1 the wealth effect ( C falls) P 2 Y 2 the interest-rate effect ( I falls) the exchange-rate effect ( NX falls) 0

Why the AD Curve Might Shift Any event that changes C , I, G, or NX—except a change in P—will shift the AD curve. Example: A stock market boom makes households feel wealthier, C rises, the AD curve shifts right. P Y AD 1 AD 2 Y 2 P 1 Y 1 0

Features of the economy in the SR Sticky prices Output can fluctuate Unemployment can deviate from natural rate Output determined by demandFeatures of the economy in the LRFlexible pricesOutput is at its potentialEconomy is at full employment Output determined by potential (LRAS)

Why the AD Curve Might Shift Changes in C Consumer ConfidenceHousehold IncomeInterest Rates*Household BorrowingMPC vs MPS*Changes in IProfit Expectations New Technologies available Investment tax incentives Access to new Foreign Markets Interest Rates*

Why the AD Curve Might Shift Changes in G Federal spending, e.g., defense State & local spending, e.g., roads, schoolsChanges in NXDomestic Product QualityForeign Household Income Domestic Price Level* Market for Domestic Suppliers Value of Domestic Currency*

ACTIVE LEARNING 1 The Aggregate-Demand curve What happens to the AD curve in each of the following scenarios? A. A ten-year-old investment tax credit expires. B. The U.S. exchange rate falls. C. A fall in prices increases the real value of consumers’ wealth. D. State governments replace their sales taxes with new taxes on interest, dividends, and capital gains. © 2012 Cengage Learning. All Rights Reserved. May not be copied, scanned, or duplicated, in whole or in part, except for use as permitted in a license distributed with a certain product or service or otherwise on a password-protected website for classroom use.

ACTIVE LEARNING 1 Answers A. A ten-year-old investment tax credit expires. I falls, AD curve shifts left. B. The U.S. exchange rate falls. NX rises, AD curve shifts right. C. A fall in prices increases the real value of consumers’ wealth. Move down along AD curve (wealth-effect). D. State governments replace sales taxes with new taxes on interest, dividends, and capital gains. C rises, AD shifts right. © 2012 Cengage Learning. All Rights Reserved. May not be copied, scanned, or duplicated, in whole or in part, except for use as permitted in a license distributed with a certain product or service or otherwise on a password-protected website for classroom use.

The Aggregate-Supply ( AS ) Curves The AS curve shows the total quantity of g&s firms produce and sell at any given price level. P Y SRAS LRAS AS is: upward-sloping in short run vertical in long run 0

The Long-Run Aggregate-Supply Curve (LRAS) Amount of output the economy produces when unemployment is at its natural rate (around 5% unemployment) YF is calledfull-employment output. P Y LRAS Y F 0

Why LRAS Is Vertical Y F determined by the economy’s stocks of labor, capital, and natural resources, and on the level of technology.An increase in P P Y LRAS P 1 does not affect any of these, so it does not affect Y F . (Classical dichotomy) P 2 Y F 0

Why the LRAS Curve Might Shift Any event that changes any of the determinants of Y F will shift LRAS. Example: Immigration increases L , causing Y F to rise. P Y LRAS 1 Y F LRAS 2 Y F1 0

Why the LRAS Curve Might Shift Changes in L or natural rate of unemploymentImmigration Baby-boomers retireGovt policies reduce natural u-rate Changes in K or HInvestment in factories, equipmentMore people get college degreesFactories destroyed by a hurricane

Why the LRAS Curve Might Shift Changes in natural resources Discovery of new mineral deposits Reduction in supply of imported oilChanging weather patterns that affect agricultural productionChanges in technologyProductivity improvements from technological progress

LRAS 1990 Using AD & AS to Depict Long-Run Growth and Inflation Over the long run, tech. progress shifts LRAS to the right P Y AD 2000 LRAS 2000 AD 1990 Y 2000 and growth in the money supply shifts AD to the right. Y 1990 AD 2010 LRAS 2010 Y 2010 P 1990 Result: ongoing inflation and growth in output. P 2000 P 2010 0

Short Run Aggregate Supply ( SRAS) The SRAS curve is upward sloping:Over the period of 1–2 years, an increase in P P Y SRAS causes an increase in the quantity of g & s supplied. Y 2 P 1 Y 1 P 2 0

Why the Slope of SRAS Matters If AS is vertical, fluctuations in AD do not cause fluctuations in output or employment. P Y AD 1 SRAS LRAS AD hi AD lo Y 1 If AS slopes up, then shifts in AD do affect output and employment. P lo Y lo P hi Y hi P hi P lo 0

Three Theories of SRAS In each, some type of market imperfection result: Output deviates from its natural rate when the actual price level deviates from the price level people expected. 0

1. The Sticky-Wage Theory Imperfection: Nominal wages are sticky in the short run, they adjust sluggishly. Due to labor contracts, social norms Firms and workers set the nominal wage in advance based on PE, the price level they expect to prevail. 0

1. The Sticky-Wage Theory If P > P E , revenue is higher, but labor cost is not. Production is more profitable, so firms increase output and employment. Hence, higher P causes higher Y, so the SRAS curve slopes upward. 0

2. The Sticky-Price Theory Imperfection: Many prices are sticky in the short run. Due to menu costs , the costs of adjusting prices. Examples: cost of printing new menus, the time required to change price tags Firms set sticky prices in advance based on PE. 0

2. The Sticky-Price Theory Suppose the Fed increases the money supply unexpectedly. In the long run, P will rise. In the short run, firms without menu costs can raise their prices immediately. Firms with menu costs wait to raise prices. Meanwhile, their prices are relatively low, which increases demand for their products,so they increase output and employment. Hence, higher P is associated with higher Y , so the SRAS curve slopes upward . 0

3. The Misperceptions Theory Imperfection: Firms may confuse changes in P with changes in the relative price of the products they sell.If P rises above PE, a firm sees its price rise before realizing all prices are rising. The firm may believe its relative price is rising, and may increase output and employment. So, an increase in P can cause an increase in Y , making the SRAS curve upward-sloping. 0

What the 3 Theories Have in Common: All three imply that Y (output) deviates from its long-run level YF (the “natural rate of output”) when the price level (P) deviates from the level people had expected (PE) Y = Y F + a ( P – PE ) Output Natural rate of output (long-run) a > 0, measures how much Y responds to unexpected changes in P Actual price level Expected price level 0

What the 3 Theories Have in Common: P Y SRAS Y F When P > P E Y > Y F When P < P E Y < Y F P E the expected price level 0 Y = Y F + a ( P – P E )

SRAS and LRAS The imperfections in these theories are temporary . Over time, sticky wages and prices become flexiblemisperceptions are correctedIn the LR, PE = P AS curve is vertical 0

LRAS SRAS and LRAS P Y SRAS P E Y F In the long run, P E = P and Y = Y F . 0 Y = Y F + a ( P – P E )

Why the SRAS Curve Might Shift Everything that shifts LRAS shifts SRAS, too. Also, PE shifts SRAS:If P E rises, workers & firms set higher wages. At each P , production is less profitable, Y falls, SRAS shifts left. LRAS P Y SRAS P E Y F SRAS P E 0

The Long-Run Equilibrium In the long-run equilibrium, P E = P, Y = Y F , and unemployment is at its natural rate. P Y AD SRAS P E LRAS Y F 0

Economic Fluctuations Caused by events that shift the AD and/or AS curves.Four steps to analyzing economic fluctuations:1. Determine whether the event shifts AD or AS. 2. Determine whether curve shifts left or right. 3. Use AD–AS diagram to see how the shift changes Y and P in the short run. 4. Use AD–AS diagram to see how economy moves from new SR eq’m to new LR eq’m. 0

LRAS Y F The Effects of a Shift in AD Event: Stock market crash 1. Affects C , AD curve 2. C falls, so AD shifts left 3. SR eq’m at B. P and Y lower,unemp higher Over time, P E falls, SRAS shifts right, until LR eq’m at C. Y and unemp back at initial levels. What if policymakers do not want to wait for self-correction? P Y AD 1 SRAS 1 AD 2 SRAS 2 P 1 A P 2 Y 2 B P 3 C 0

Two Big AD Shifts: 1. The Great Depression From 1929–1933, money supply fell 28% due to problems in banking systemstock prices fell 90%, reducing C and I Y fell 27% P fell 22% u-rate rose from 3% to 25% U.S. Real GDP , billions of 2000 dollars 0

Two Big AD Shifts: 2. The World War II Boom From 1939–1944, Gov’t outlays rose from $9.1 billion to $91.3 billion Y rose 90% P rose 20% Unempoyment fell from 17% to 1% U.S. Real GDP , billions of 2000 dollars 0

ACTIVE LEARNING 2 Working with the model Draw the AD-SRAS-LRAS diagram for the U.S. economy starting in a long-run equilibrium. A boom occurs in Canada. Use your diagram to determine the SR and LR effects on U.S. GDP, the price level, and unemployment. © 2012 Cengage Learning. All Rights Reserved. May not be copied, scanned, or duplicated, in whole or in part, except for use as permitted in a license distributed with a certain product or service or otherwise on a password-protected website for classroom use.

ACTIVE LEARNING 2 Answers © 2012 Cengage Learning. All Rights Reserved. May not be copied, scanned, or duplicated, in whole or in part, except for use as permitted in a license distributed with a certain product or service or otherwise on a password-protected website for classroom use. LRAS Y F P Y AD 2 SRAS 2 AD 1 SRAS 1 P 1 P 3 C P 2 Y 2 B A Event: Boom in Canada 1. Affects NX , AD curve 2. Shifts AD right 3. SR eq’m at point B. P and Y higher, unemp lower 4. Over time, P E rises, SRAS shifts left, until LR eq’m at C. Y and unemp back at initial levels.

LRAS Y F The Effects of a Shift in SRAS Event: Oil prices rise 1. Increases costs, shifts SRAS (assume LRAS constant) 2. SRAS shifts left 3. SR eq’m at point B. P higher, Y lower,unemp higher From A to B, stagflation , a period of falling output and rising prices. P Y AD 1 SRAS 1 SRAS 2 P 1 A P 2 Y 2 B 0

LRAS Y F Accommodating an Adverse Shift in SRAS If policymakers do nothing, 4. Low employment causes wages to fall, SRAS shifts right, until LR eq’m at A. P Y AD 1 SRAS 1 SRAS 2 P 1 A P 2 Y 2 B AD 2 P 3 C Or, policymakers could use fiscal or monetary policy to increase AD and accommodate the AS shift: Y back to Y F , but P permanently higher. 0

The 1970s Oil Shocks and Their Effects # of unemployed persons Real GDP CPI + 1.4 million + 2.9% + 26% + 99% + 3.5 million – 0.7% + 21% + 138% Real oil prices 1978–80 1973–75 0

John Maynard Keynes, 1883–1946 The General Theory of Employment, Interest, and Money , 1936 Argued recessions and depressions can result from inadequate demand; policymakers should shift AD.Famous critique of classical theory: Economists set themselves too easy, too useless a task if in tempestuous seasons they can only tell us when the storm is long past, the ocean will be flat. The long run is a misleading guide to current affairs. In the long run, we are all dead. 0

Monetary Policy and Aggregate Demand To achieve macroeconomic goals, the Fed can use monetary policy to shift the AD curve. The Fed’s policy instrument is MS. The news often reports that the Fed targets the interest rate. More precisely, the federal funds rate, which banks charge each other on short-term loans To change the interest rate and shift the AD curve, the Fed conducts open market operations to change MS . 0

The Effects of Reducing the Money Supply Y P M Interest rate AD 1 MS 1 MD P 1 Y 1 r 1 MS 2 r 2 AD 2 Y 2 The Fed can raise r by reducing the money supply. An increase in r reduces the quantity of g&s demanded. 0

ACTIVE LEARNING 2 Monetary policy For each of the events below, - determine the short-run effects on output - determine how the Fed should adjust the money supply and interest rates to stabilize output A. Congress tries to balance the budget by cutting govt spending. B. A stock market boom increases household wealth. C. War breaks out in the Middle East, causing oil prices to soar. © 2012 Cengage Learning. All Rights Reserved. May not be copied, scanned, or duplicated, in whole or in part, except for use as permitted in a license distributed with a certain product or service or otherwise on a password-protected website for classroom use.

ACTIVE LEARNING 2 Answers A. Congress tries to balance the budget by cutting govt spending. This event would reduce agg demand and output. To stabilize output, the Fed should increase MS and reduce r to increase agg demand. © 2012 Cengage Learning. All Rights Reserved. May not be copied, scanned, or duplicated, in whole or in part, except for use as permitted in a license distributed with a certain product or service or otherwise on a password-protected website for classroom use.

ACTIVE LEARNING 2 Answers B. A stock market boom increases household wealth. This event would increase agg demand, raising output above its natural rate. To stabilize output, the Fed should reduce MS and increase r to reduce agg demand.© 2012 Cengage Learning. All Rights Reserved. May not be copied, scanned, or duplicated, in whole or in part, except for use as permitted in a license distributed with a certain product or service or otherwise on a password-protected website for classroom use.

ACTIVE LEARNING 2 Answers C. War breaks out in the Middle East, causing oil prices to soar. This event would reduce agg supply, causing output to fall. To stabilize output, the Fed should increase MS and reduce r to increase agg demand. © 2012 Cengage Learning. All Rights Reserved. May not be copied, scanned, or duplicated, in whole or in part, except for use as permitted in a license distributed with a certain product or service or otherwise on a password-protected website for classroom use.

Liquidity traps Monetary policy stimulates aggregate demand by reducing the interest rate. Liquidity trap : when the interest rate is zero In a liquidity trap, mon. policy may not work, since nominal interest rates cannot be reduced further. However, central bank can make real interest rates negative by raising inflation expectations.Also, central bank can conduct open-market ops using other assets—like mortgages and corporate debt—thereby lowering rates on these kinds of loans. The Fed pursued this option in 2008–2009.

Fiscal Policy and Aggregate Demand Fiscal policy : the setting of the level of govt spending and taxation by govt policymakers Expansionary fiscal policyan increase in G and/or decrease in Tshifts AD rightContractionary fiscal policya decrease in G and/or increase in Tshifts AD left Fiscal policy has two effects on AD ... 0

1. The Keynesian Spending Multiplier If the gov’t buys $20b of planes from Boeing, Boeing’s revenue increases by $20b. This is distributed to resource suppliers (households) - Boeing’s workers (as wages) and owners (as profits or stock dividends). These people are also consumers and will spend a portion of the extra income – becomes income for other households This extra consumption causes further increases in aggregate demand. Multiplier effect : the additional shifts in AD that result when fiscal policy increases income and thereby increases consumer spending 0

1. The Keynesian Spending Multiplier A $20B increase in G initially shifts AD to the right by $20B. The increase in Y causes C to rise, which shifts AD further to the right. Y P AD 1 P 1 AD 2 AD 3 Y 1 Y 3 Y 2 $20 billion 0

Marginal Propensity to Consume/Save How big is the multiplier effect? It depends on how much consumers respond to increases in income. Marginal propensity to Consume (MPC) : the fraction of extra income that households consume rather than saveMarginal Propensity to Save (MPS): the fraction of extra income that households save rather than consume Example: if income rises $100 and C rises $80 MPC = 0.8 MPS = 1-MPC…..thus MPS = 0.2 0

Other Applications of the Multiplier Effect The multiplier effect: Each $1 increase in G can generate more than a $1 increase in AD. Also true for the other components of GDP (C,I,Nx) Example: Suppose a recession overseas reduces demand for U.S. net exports by $10B. Initially, AD falls by $10B. The fall in Y causes C to fall, which further reduces AD and income. * Multiplier = 1/MPS or 1/(1-MPC) 0

2. The Crowding-Out Effect Fiscal policy has another effect on AD that works in the opposite direction. A fiscal expansion raises r, which reduces investment, which reduces the net increase in agg demand. So, the size of the AD shift may be smaller than the initial fiscal expansion. This is called the crowding-out effect. 0

How the Crowding-Out Effect Works Y P M Interest rate AD 1 MS MD 2 MD 1 P 1 r 1 r 2 A $20b increase in G initially shifts AD right by $20b But higher Y increases MD and r , which reduces AD . AD 3 AD 2 Y 1 Y 2 $20 billion Y 3 0

Changes in Taxes A tax cut increases households’ take-home pay. Households respond by spending a portion of this extra income, shifting AD to the right. The size of the shift is affected by the multiplier and crowding-out effects. Another factor: whether households perceive the tax cut to be temporary or permanent. A permanent tax cut causes a bigger increase in C—and a bigger shift in the AD curve—than a temporary tax cut. 0

ACTIVE LEARNING 3 Fiscal policy effects The economy is in recession. Shifting the AD curve rightward by $ 200B would end the recession. A. If MPC = .8 and there is no crowding out, how much should Congress increase G to end the recession?B. If there is crowding out, will Congress need to increase G more or less than this amount? © 2012 Cengage Learning. All Rights Reserved. May not be copied, scanned, or duplicated, in whole or in part, except for use as permitted in a license distributed with a certain product or service or otherwise on a password-protected website for classroom use.

ACTIVE LEARNING 3 Answers The economy is in recession. Shifting the AD curve rightward by $ 200B would end the recession. A. If MPC = .8 and there is no crowding out, how much should Congress increase G to end the recession? Multiplier = 1/(1 – .8) = 5 Increase G by $40b to shift AD by 5 x $40b = $200b. © 2012 Cengage Learning. All Rights Reserved. May not be copied, scanned, or duplicated, in whole or in part, except for use as permitted in a license distributed with a certain product or service or otherwise on a password-protected website for classroom use.

ACTIVE LEARNING 3 Answers The economy is in recession. Shifting the AD curve rightward by $ 200B would end the recession. B. If there is crowding out, will Congress need to increase G more or less than this amount? Crowding out reduces the impact of G on AD. To offset this, Congress should increase G by a larger amount. © 2012 Cengage Learning. All Rights Reserved. May not be copied, scanned, or duplicated, in whole or in part, except for use as permitted in a license distributed with a certain product or service or otherwise on a password-protected website for classroom use.

Tax Multiplier How much RGDP inc. or dec. b/c of Δ in autonomous TMtax = -MPC/MPSMtax * Change in taxesEx: tax rates reduced 5%Tax Revenue dec. 300B MPC = 0.8 Multiplier = ? Change in RGDP = ? 0

Balanced Budget Multiplier How much RGDP inc. or dec. b/c of equal Δ in G & TCombines Mexpenditure & MtaxEqual to 1 b/c multiplier effects offset all but initial Δ in autonomous G 0

Using Policy to Stabilize the Economy Since the Employment Act of 1946, economic stabilization has been a goal of U.S. policy. Economists debate how active a role the govt should take to stabilize the economy. 0

The Case for Active Stabilization Policy Keynes: “Animal spirits” cause waves of pessimism and optimism among households and firms, leading to shifts in aggregate demand and fluctuations in output and employment. Also, other factors cause fluctuations, e.g. , booms and recessions abroadstock market booms and crashes If policymakers do nothing, these fluctuations are destabilizing to businesses, workers, consumers. 0

The Case for Active Stabilization Policy Proponents of active stabilization policy believe the gov’t should use policy to reduce these fluctuations: Recessionary Gap: When GDP falls below its natural rate, use expansionary monetary or fiscal policy to prevent or reduce a recession.Inflationary Gap: When GDP rises above its natural rate, use contractionary policy to prevent or reduce an inflationary boom. 0

Keynesians in the White House 1961: John F Kennedy pushed for a tax cut to stimulate AD. Several of his economic advisors were followers of Keynes 2009: Barack Obama pushed for spending increases and tax cuts to increase AD in the face of a deep recession. 0

The Case Against Active Stabilization Policy Monetary policy affects economy with a long lag: Firms make investment plans in advance, so I takes time to respond to changes in interest rate~ 6 months for monetary policy to affect output and employmentFiscal policy also works with a long lag:Changes in G and T require acts of Congress The legislative process can take months or years 0

The Case Against Active Stabilization Policy Due to these long lags, critics of active policy argue that such policies may destabilize the economy rather than help it: By the time the policies affect AD, the economy’s condition may have changed. These critics contend that policymakers should focus on long-run goals like economic growth and low inflation. 0

Automatic Stabilizers Automatic stabilizers : Auto changes in fiscal policy that stimulate AD when economy goes into recession The tax systemIn recession, taxes fall automatically (pay less)which stimulates AD.Gov’t spendingIn recession, more people apply for public assistance (welfare, unemployment insurance). Gov’t spending on these programs automatically rises, which stimulates agg demand. 0