PPT-Debt of Graduates and Cohort Default Rates at Stony Brook University
Author : calandra-battersby | Published Date : 2019-11-01
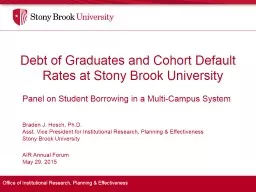
Debt of Graduates and Cohort Default Rates at Stony Brook University Panel on Student Borrowing in a MultiCampus System Braden J Hosch PhD Asst Vice President for
Presentation Embed Code
Download Presentation
Download Presentation The PPT/PDF document "Debt of Graduates and Cohort Default Rat..." is the property of its rightful owner. Permission is granted to download and print the materials on this website for personal, non-commercial use only, and to display it on your personal computer provided you do not modify the materials and that you retain all copyright notices contained in the materials. By downloading content from our website, you accept the terms of this agreement.
Debt of Graduates and Cohort Default Rates at Stony Brook University: Transcript
Download Rules Of Document
"Debt of Graduates and Cohort Default Rates at Stony Brook University"The content belongs to its owner. You may download and print it for personal use, without modification, and keep all copyright notices. By downloading, you agree to these terms.
Related Documents