/
Map Projections No map projection is perfect and all maps Map Projections No map projection is perfect and all maps

Map Projections No map projection is perfect and all maps - PowerPoint Presentation

calandra-battersby
calandra-battersby . @calandra-battersby
Follow
364 views
Uploaded On 2018-02-04

Map Projections No map projection is perfect and all maps - PPT Presentation

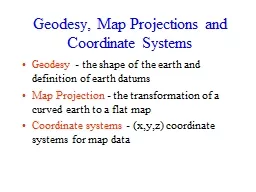
distort a certain property Definition The representation of the globe on a two dimensional flat map All maps have four features that can be distorted that include Shape Size area distance and direction The reason for this being that there is no perfect way to represent a 3D object on ID: 627867

maps map thematic distortion map maps distortion thematic dot area size shape flat types distorts show data projections bottom

Share:

Link:

Embed:

Download Presentation from below link

Download Presentation The PPT/PDF document "Map Projections No map projection is per..." is the property of its rightful owner. Permission is granted to download and print the materials on this web site for personal, non-commercial use only, and to display it on your personal computer provided you do not modify the materials and that you retain all copyright notices contained in the materials. By downloading content from our website, you accept the terms of this agreement.


Presentation Transcript

Slide1

Map ProjectionsSlide2

No map projection is perfect and all maps

distort a certain property

.

Definition: The representation of the globe on a two dimensional flat map.

All maps have four features that can be distorted that include: Shape, Size (area), distance, and direction. The reason for this being that there is no perfect way to represent a 3-D object on a 2-D plane. Each different type of map sacrifices one or more of these properties to make a flat map.

Map ProjectionsSlide3

Map Name

Map

Uses

Distortion

Way to identifyRobinson

Just a compromise.

Distorts a little bit of everything.Round sides and flat top and bottom.Slide4

Map Name

Map

Uses

Distortion

Way to identifyMercator

Used by

ships for navigation.Size and shape especially at the poles.Greenland looks about the same size as Africa.Slide5

Map Name

Map

Uses

Distortion

Way to identifyGoode

HomolosineSlide6

Map Name

Map

Uses

Distortion

Way to identifyPolar

Used for airline

companies to discover cheapest route across oceans.Distorts the bottom half of the globe.It’s completely round and the image is from above looking down.Slide7

Map Name

Map

Uses

Distortion

Way to identifyPeter

Preserves area to accurately display the actual land mass especially to “third world” countries, that were mapped biasedly earlier.

Shape of countries especially near the equator.Africa and South America are longer and Europe is more compact.Slide8

Map Name

Map

Uses

Distortion

Way to identifyAzimuthalSlide9

Reference Maps-

show features related to location which can be

natural

or man-made. For example: road maps, political maps,and topographical maps.

Thematic Maps- are based on a particular characteristic or theme. Different types of thematic maps are better suited to

represent

some data than others, depending on the data and the objectiveTypes of MapsSlide10

Types of thematic maps

Choropleth mapping

shows statistical data aggregated over predefined regions, such as counties or states, by coloring or shading these regions.

Choropleth map of water use.Slide11

Thematic map

A

Cartogram

- distorts land area based on some variable .

Population 2050Slide12

Thematic map

Acres of Harvested Wheat in Illinois in 2012

A

dot distribution

map (also known as dot density map) is a map type that uses a dot symbol to show the presence of a feature or phenomenon. Dot maps rely on a visual scatter to show spatial pattern.Slide13

You better know your Map Projections and Types of Maps!