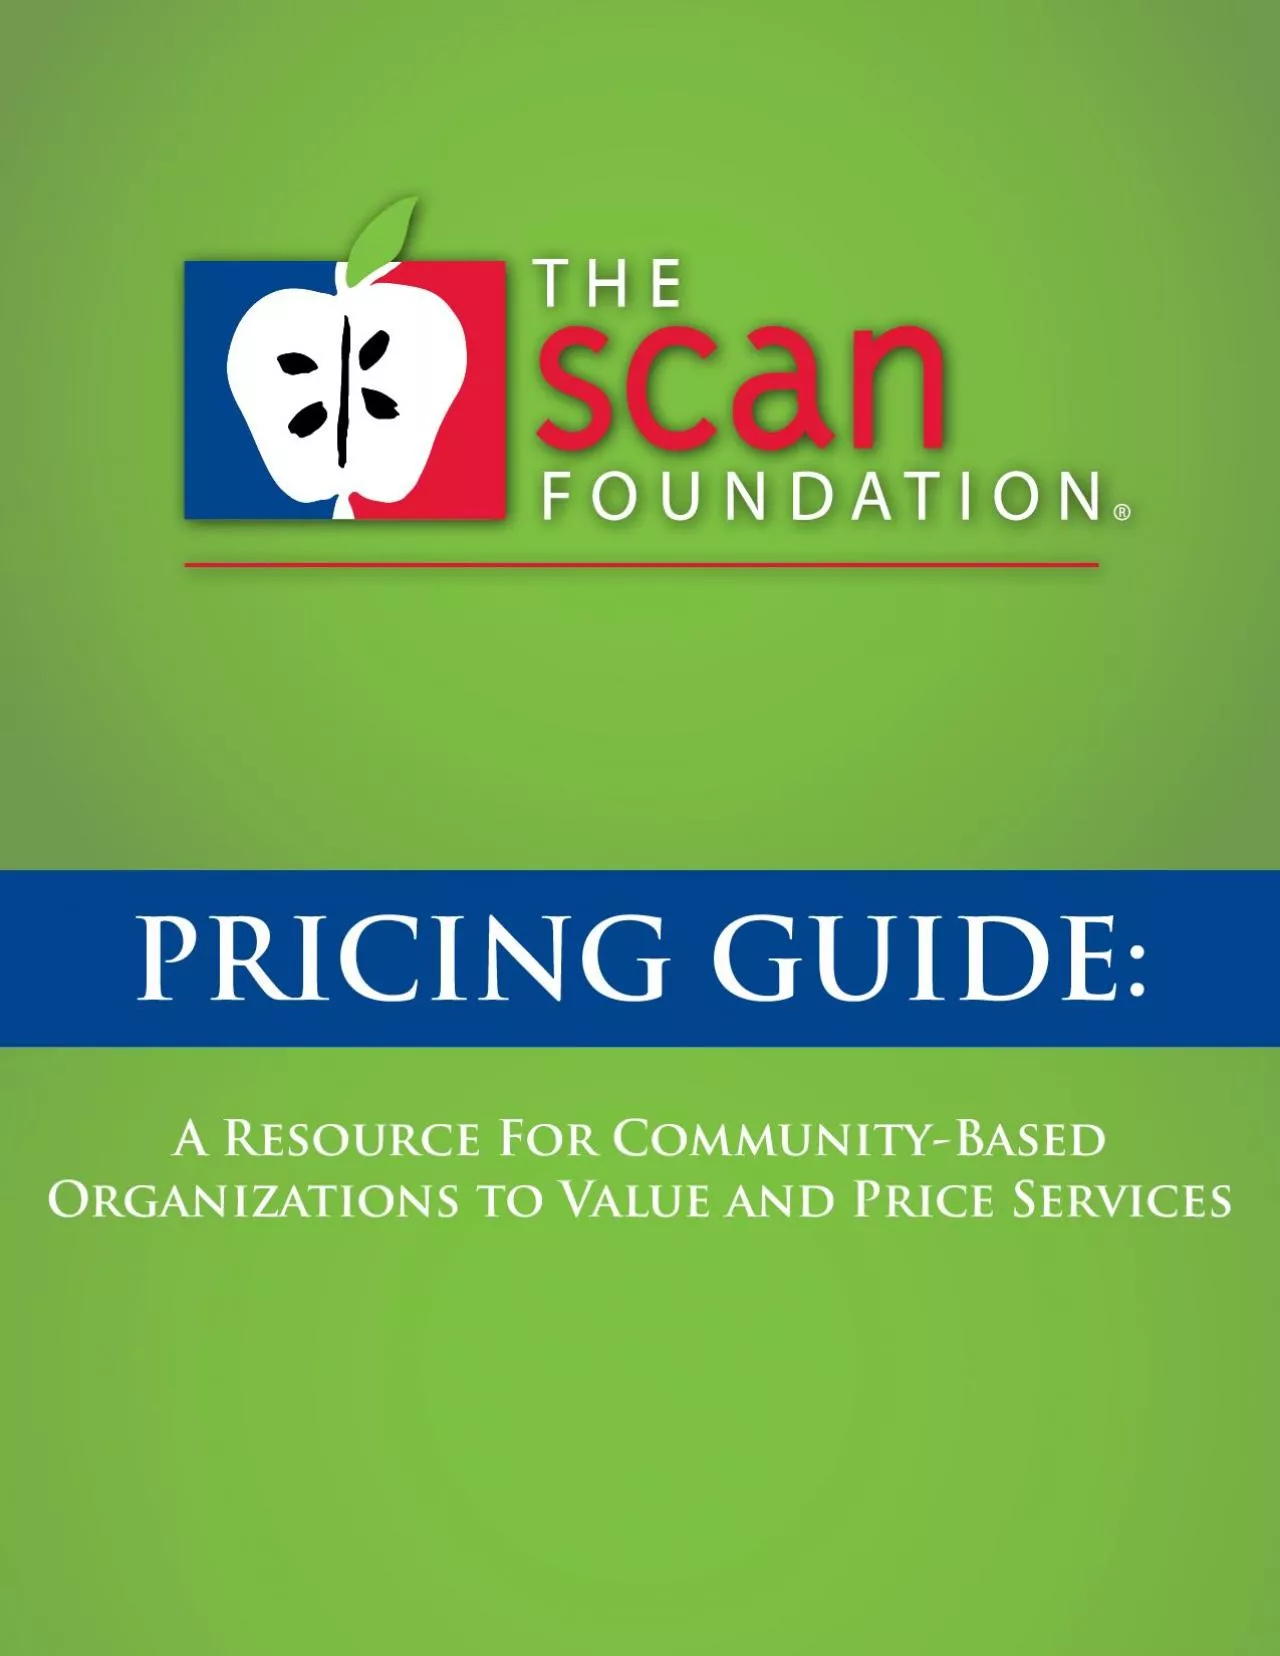
/
PRICING GUIDEA Resource For CommunityBased Organizations to Value and PRICING GUIDEA Resource For CommunityBased Organizations to Value and

PRICING GUIDEA Resource For CommunityBased Organizations to Value and - PDF document

callie
callie . @callie
Follow
342 views
Uploaded On 2021-09-26

PRICING GUIDEA Resource For CommunityBased Organizations to Value and - PPT Presentation

2INTRODUCTION TO THE PRICING GUIDE Pricing Thermometer Value Value Proposition vs CompetitorsNEXT STEPSA The Marketing MixB Root Cause Analysis ToolD Additional Resources on Pricing and ValueF Co ID: 886444

service costs price x00740069 costs service x00740069 price pricing cost product 150 148 147 care services x00660069 total seller

Share:

Link:

Embed:

Download Presentation from below link

Download Pdf The PPT/PDF document "PRICING GUIDEA Resource For CommunityBas..." is the property of its rightful owner. Permission is granted to download and print the materials on this web site for personal, non-commercial use only, and to display it on your personal computer provided you do not modify the materials and that you retain all copyright notices contained in the materials. By downloading content from our website, you accept the terms of this agreement.


Presentation Transcript

1 PRICING GUIDE:A Resource For Community-B
PRICING GUIDE:A Resource For Community-Based Organizations to Value and Price Services 2 INTRODUCTION TO THE PRICING GUIDE ........................................................ Pricing Thermometer Value Value Proposition vs. CompetitorsNEXT STEPS.........................................................................................................A. The Marketing MixB. Root Cause Analysis ToolD. Additional Resources on Pricing and ValueF. Cost Per Unit Calculation ToTABLE OF CONTENTS Pricing Guide 3 The SCAN Founda�on: Pricing Guide If you are like most community-based organizations, you receive the majority of your current funding from government contracts and foundation grants. Usually, these contracts are based on line-item budgets for M very speci�c scope of RorkB HoRever, over POe lMsP feR yeMrs neR poPenPiMl funding sources OMve materialized, primarily through the implementation of the new health care law. Certain provisions, Overview of Preparing Community-Based Organizations for Successful Health - Dr. Victor Tabbush, 2012). While this is an important recognition that will greatly WOy, you Funding mechanisms in the health care sector are quite different from those of most community-based organizations. There is the well-known fee-for-service system, whereby medical providers a

2 re reimNursed NMsed on POe numNer of spe
re reimNursed NMsed on POe numNer of speci�c services POey deliverB ReimNursemenPs cMn Mlso Ne NMsed on M procedures for one service payment. And then there is the capitation system, whereby providers get paid Community-based organizations seeking to become contractual partners with the health care sector will likely have to move from traditional line-item budgets to a fee-for-service, capitation, bundled, or hybrid model. All of these reimbursement models require that community-based organizations know how to determine the cost of each of their services, and price these services in a way that make them market competitive. The SCAN Foundation developed this Pricing Guide to provide community-based organizations a basic introduction to determining cost and establishing prices. The guide provides some narrative considerations, along with some helpful tools. We welcome your feedback on the utility of this resource so we can improve its effectiveness. We look forward to traveling with you on this journey of developing integrated medical care and René Seidel Vice President, Programs & OperationsIntroduction to the Pricing Guide 4 Market PowerThe ability to set prices depends on how much “market power” a seller has. The more market power, the greater the ability to set prices. There are

3 four levels of pricing control. (See Fi
four levels of pricing control. (See Figure 1). The SCAN Founda�on: Pricing GuidePricing is complex. The goal of this guide is to provide an entry into pricing by combining both economics and marketing principles. Section 1 goes through the key pricing structures to determine which works best for the organization and service/product line. Section 2 covers how to determine the price for a specific service or product and assign value to it. Section 3 “Pricing is the moment of truth – all of marketing comes to focus in the pricing decision.” - Professor Raymond Corey, Harvard Business School“Price is what you pay. Value is what you get.” - Warren BuffettSection 1: Pricing StructuresCritical to the success of the development of any business line is determining the best pricing structure to achieve the necessary revenue. This section of the guide provides assistance in Unilateral: Buyer Buyer Sets Price:Seller Must Takeit or Leave it Bilateral: Cost Recovery to the Buyer on theBasis of Cost Bilateral: Unilateral: Seller Seller Sets Price:Buyer Must Takeit or Leave it LOWHIGH Source: Professor Emeritus Victor Tabbush, PhD UCLA Anderson School of Management Figure 1: Seller’s Price Control 5 Unilateral (B

4 uyer Power): In this scenario, the buyer
uyer Power): In this scenario, the buyer has all the power. A price is offered to the seller and the seller must take it or leave it. When this occurs, the seller must to determine whether or not to accept the offered price. Example: A Community Based Organization (CBO) is a home delivered meal r the local Area Agency on Aging (AAA). The AAA will pay the CBO a predetermined price for each meal delivered regardless of the cost to the CBO.Here, the buyer still has more power than the seller. The buyer is willing to cover the seller’s costs and maybe provide some additional level of profit. and be able to justify them to the buyer.Example: A CBO submits a grant proposal to a local foundation to provide home delivered meals to the community. In the application process, the CBO requests the total cost of the meals to be covered through grant funding. There is close to equal power between the seller and buyer. A negotiation occurs to determine the price. The seller will emphasize the of their product relative to competitors. Buyers will want to know the sellers’ and try to keep Example: A CBO has been providing home delivered meals as an AAA contractor. The AAA is developing a new contract with a hospital to provide meals to an identified set of patients upon discharge for a two-week period in orde

5 r to reduce readmission to the hospital.
r to reduce readmission to the hospital. The AAA knows the current reimbursement rate they have in place with the CBO. The CBO knows that the AAA cannot successfully engage in this new partnership without their agreement to be a meal provider. The CBO can use the value they provide to the AAA to negotiate a higher rate per meal, while the AAA can Seller Power): The seller has all the power. A price is offered to buyers and Value is the key driver of price, but the value proposition must still remain competitive with other sellers to the extent there is competition in the A family caregiver would like to have their parent receive home delivered r parent does not meet the income requirements for free services. The CBO offers to provide a meal at a set cost that the family will have to pay if they want their parent to receive home delivered meals. 6 The Pricing Model is the overall scheme of how an organization captures revenue for its products or services. The model should make economic sense to the seller and be acceptable to the customers. There are many types of creative and sophisticated pricing models. 1. Fee-for-Service 2. Capitation Each of these models yields different patterns of profits and has different risks. Basic Cost StructuresThe profit patterns for Fee-for-Service and Capitati

6 on are affected by cost structures. Bas
on are affected by cost structures. Basic categories of costs are Fixed and Variable Costs.se Mre expenses POMP do noP increMse RiPO volumeB An exMmple is of�ce space. Variable Costs: These are expenses that increase proportionally with volume. An example ingredients for home-delivered meals. Note: A more advanced discussion on costs is presented in Section 2.Fee-for-ServiceFee-for-Service (FFS) contracts pay set rates each time the service is utilized. For example, pricing for cab service is based on the number of miles driven where the unit of service is the “mile.” Figure 2 illustrates how FFS pricing performs under fixed and variable cost structures. Higher utilization increases profits for the seller as long as the fee covers the variable cost of the service. The seller has a financial incentive to provide as many services as possible. Utilization management and authorization systems need to be implemented to prevent over-utilization by the seller, while maintaining quality of care. 7 An example of a high fixed costs service is a skilled nursing facility. The fixed costs for the building are greater than the variable costs for nursing staff and supplies. With a FFS pricing model, the facility needs to keep the rooms as close to full capacity as possible to cover their expenses and ma

7 ke a profit. An example of low fixed co
ke a profit. An example of low fixed costs service is at-home nursing care. Since a physical building to provide care is not required, the variable costs for nurses, supplies, and fuel are greater than the fixed costs. Under FFS, expenses will be covered and profitability occurs even at a lower volume of services. However, each home visit adds to the profit provided the fee exceeds the variable cost per unit. Capitation contracts pay a set periodic rate for each covered person. There is no fixed cap on the amount of services an individual can receive during a given period. Figure 3 illustrates how Capitation pricing performs under fixed and variable cost structures. Contrary to FFS, high utilization decreases profits. The seller has a financial incentive to keep the number of services low. Utilization management and authorization systems need to be , while maintaining quality of care. Figure 2: Fee-For-Service Model Volume ofServicesTotal revenuesincrease as volume increases Revenues Total Revenues$ Volume ofServices Higher Fixed Costs Total Revenues$TotalCostsBreak-even Q Volume ofServices Lower Fixed Costs Total Revenues$TotalCostsBreak-even Q 8 In the skilled nursing facility example noted previously (lower variable costs), a capitation contract will relieve the pressure to keep the rooms fully-occupied. I

8 nstead, high occupancy could resulP in &
nstead, high occupancy could resulP in �nMnciMl lossesBIn the at-home nursing care example (higher variable costs), a capitation contract is only pro�PMNle MP loRer volumesB As volume of services increMses, POe orgMnizMPion mMy fMll inPo M Also referred to as “pay-for-performance” or “royalty” models, incentive-based contracts pay a percentage of resulting revenues or profits, or a percentage of resulting cost savings (for example from reduced hospitalizations of a client). Revenue may not be directly related to the volume of services. The financial goal is to generate the largest incentive payment with the lowest total costs. The operational goal is to align the interests of the buyer with the seller so that both parties strive for the same results. This model is high risk, high reward for sellers and low risk, low reward to buyers. Sellers only get paid if the buyer receives resulting benefits from the purchase. For the seller, this creates uncertain revenue, delays cash flows (as incentive payments are usually made long after the service has been delivered), and creates monitoring costs. Sellers will have to monitor and track resulting profits or cost savings. There is a risk that buyers will intentionally or unintentionally underreport the profits, revenues, or cost-

9 savings for the incentive calculation.
savings for the incentive calculation. Sellers may also have to bear the upfront costs of generating a benefit to the buyer. On the other hand, a properly executed pay-for-performance contract can allow sellers to share in substantial successes. Buyers may also be more willing to accept this payment model since it reduces their risks. Figure 3: Capitation Model Volume ofServicesTotal revenues areconstant as volumeincreaseRevenues Total Revenues$ Volume ofServices Lower Variable Costs Total Revenues$TotalCostsBreak-even Q Volume ofServices Higher Variable Costs Total Revenues$TotalCostsBreak-even Q 9 The pricing models described above do not have to be mutually exclusive. A hybrid or blend of the pricing models may be preferable to both buyers and sellers. Two examples are presented below: A lower FFS rate combined with an incentive payment for meeting certain milestones Some potential for higher payoffsExMmple: A OeMlPO plMn �nds POMP Oome meMl deliveries folloRing OospiPMl discOMrges reduce readmission rates. It contracts with a meal delivery service and agrees to pay a FFS rate equal to the cost of providing the meals. If the patient readmission rates decline, the service provider will receive a percentage of the resulting cost savings from the reduced readmissions. Figure 4: Pricing Models -

10 Advantages and Disadvantages from the P
Advantages and Disadvantages from the Perspective of the Seller. AdvantagesDisadvantagesFee-For- ServiceBe�er for low �xed costs and high variable costsPreferred when the volume of services to be delivered to the client/pa�ent is not subject to the seller’s controlNeed higher volumes to generate pro�tFinancial incen�ve to over-u�lize servicesCapita�onBe�er for lower variable costs and high �xed costsMost predictable revenue streamPreferred when the seller can exert control on the volume of services provided to the client/pa�entIigher u�liza�on will generate lossesFinancial incen�ve to under-u�lize servicesIncen�vePoten�al for higher payo�sLowers risk to buyersAligns interests of buyer and sellerAddi�onal costs for monitoringIighly vola�le revenue streamDelays in cash �ow 10 Cover most services under a capitation contract, but use FFS for certain costly servicesExample: Some health plans have capitated contracts with hospitals that exclude certain rare and costly services. These services are covered under a FFS arrangement, while all other services are capitated. 11 Section 2: Setting a Price In

11 microeconomics, pricing depends on how m
microeconomics, pricing depends on how much market power a company has. A series of charts and formulas will lead to a point of profit maximization. Another approach to pricing is found in marketing and is based on the 4 P’s of the Product, Promotion, Place, and Price (this is described in Appendix A). The following combines concepts from both economics and marketing to help with pricing a product or service. The Pricing Thermometer. Value: The price must be lower than the value of the product to give customers a reason to buy. Buyers will not pay more than the value they place on the product. If price is equal to the value, then theoretically customers will be indifferent between buying and not buying. Value can be further delineated between “Economic Value to the Customer (EVC)” and the “Perceived Value.” : is the true value of the product or service. Perceived Value: is what customers “think” the product is worth. Often the customer is unaware of the EVC until they actually purchase and use the product. For example, customers probably did not know how much they valued their first smartphone until they bought it and became familiar with all of its features. There will always be a difference between the full EVC and the “Perceived Value” of a product.

12 The price must be greater than the cost
The price must be greater than the cost to prevent a loss. However, there are several costs should be considered in pricing decisions. These costs are covered in more detail in the Costs section on page 16. The “Pricing Thermometer” (Figure 5) gauges these key factors to help determine a price. Price 12 Figure 5: The Pricing Thermometer CostPricePerceived ValueEVC Inducement Source: Professor Andres Terech, UCLA Anderson School of Management Inducement to Buy (Value Proposition)The difference between the value and the price is the “Inducement to Buy” for a customer. If a refreshing bottle of water is valued at $2 and it is on sale for $1, then there is an economic reason to buy it. However, if the price was $2.50, then customers would not buy it. This is also referred to as the “Value Proposition.”The difference between cost and price is the “Contribution Margin.” This is how much each unit sold will add to profit or surplus. Area of NegotiationPrice will be somewhere between the perceived value of the product and its cost. This is the “Area of Negotiation.” The next part of the guide will go into each of the factors of the Pricing Thermometer in more 13 ValueThe value of a product or service can be hard to quantify. One method of estimating value is to

13 use a competing product or service as a
use a competing product or service as a reference point. The price of the competing service will be the reference value. The customer’s cost to make or perform the services themselves can also be used as another reference value. The value of a product will be based on this reference value plus or minus a differentiation value. The differentiation value is the value of the product features that are different from the competitor. Value = ReferenceValueDifferentiationValue Price can be more or less than a competitor’s price. If the product is almost perfectly identical, then they should be the same price. Soda is a good example of this scenario. When products have more differentiation, prices will vary. A higher price is possible if a product has more value. Or, the seller may have to settle for a lower price if the value is lower. The television market is a good example of this situation. The most technologically advanced TVs are priced higher than the basic models. Reference values The customer’s cost and ability to make the product or perform the service themselves nd customer costs may be hard to identify when prices are not publicly available. Creative market research techniques will be necessary to do so. Potential sources to get an estimate of this information are sellers and buyers

14 in other geographical markets. These org
in other geographical markets. These organizations may be open to sharing their prices and costs since they will not be in direct competition. IRS 990 Forms also reveal information that can be used to estimate these values. Sources of differentiation valueTypes and utilization of technology 14 It is important to identify the proper source of differentiation value. If the wrong features are used to determine value, the entire price analysis will be flawed. In one example, a computer manufacturer thought that speed was the main driver of value. Since their new computer was faster than everything on the market, they increased the price accordingly. In reality, consumers valued software compatibility, reliability, and technical support above speed. The result was that sales stalled and the computer had to be redesigned to emphasize the true valuable features. n if the value can be perfectly quantified, the product will still need to be promoted so that the “Perceived Value” is close to its true value (EVC). This is the goal of “Promotion” in the “Marketing Mix” (see Appendix A). Value Proposition vs. CompetitorsOnce an estimate of the value is established, a compelling value proposition needs to be offered to the customers. This is also referred to as “consumer surplus” or &#

15 147;inducement to buy.” Numericall
147;inducement to buy.” Numerically, the value proposition is the difference between the perceived value of the product and its price. To be competitive, the value proposition must be comparable to the competitor’s. Even with service differentiation advantages, the price will still be constrained by the competitor’s value proposition. In Figure 6, the service is valued at $50, which is more than the competition. However, the competitor’s price offers a value proposition of $8. Therefore the organization must also offer a value proposition of at least $8 and price accordingly at $42. Otherwise, the product will be perceived as a bad deal and sales will suffer. 15 Figure 6: The Value Proposi�on Must be Compe��veSource: Professor Emeritus Victor Tabbush, PhD, UCLA Anderson School of Management Compe�tor’s Perceived ValueCompe�tor’sProposi�on Compe�tor’s Price 50$454237 Your Perceived ValueYour ValueProposi�on Your Price YOU COMPETITOR *Not to scale Example: A managed care organization has determined that they want to start providing meals to their patients for two-weeks post discharge. A large national company can drop ship two weeks of frozen meals to the patient for $56. An organization in the comm

16 unity can provide hot home delivered mea
unity can provide hot home delivered meals. This service offers additional value, since the hot meals are healthier and the community-based organization can check on the patient during the deliveries. Based on this analysis, the CBO prices their meal delivery at $100 for two weeks. However, the managed care organization is reluctant to contract with the CBO because they can call the patients to check on them, so the additional value of hot meal deliveries is not worth the higher price. It may be tempting to offer a greater value proposition than the competitors in order to capture more of the market. However, this may lead to a “price war” that reduces the contribution margin for all sellers. Competitors may react by lowering their prices to match the value proposition and maintain their market share. If this happens, it would have been better to match the original value proposition with a higher price. 16 CostsCosts, Fixed Not-Sunk Costs, and Variable Costs. TOese Mre �xed expenses POMP Rill Ne incurred Ny POe orgMnizMPion regMrdless of ROePOer or noP the sales opportunity or contract is pursued. These expenses will not be affected by volume.SHOULD NOT be included in the Price Thermometer or when determining the price. Sometimes these costs are referred to as “indirect

17 8; costs and allocated via an indirect c
8; costs and allocated via an indirect cost percentage. Management trainingAccountingExisPing of�ce spMceExisting equipment For simplicity, this guide will refer to these costs as “Sunk Costs.” TOese Mre �xed expenses POMP Rill Ne incurred only if POe sMles opporPuniPy is pursuedB These expenses will not vary with volume. be included in the pricing analysis.AddiPionMl of�ce spMce requiremenPs For simplicity, this guide will refer to these costs as “Fixed Costs.”: A common fallacy of the “economies of scale” concept is that increasing volume will reduce MverMge cosPsB TOis Mssumes POMP �xed cosPs Mre �xed irrespecPive of OoR OigO volume migOP goB HoRever, MP some lMrge scMle, �xed cosPs mMy OMve Po increMse Po provide needed cMpMciPyB These increases will exhibit a “step” function. For example, one supervisor may be able to manage �ve nursesB Every 6PO nurse Rill require Mn MddiPionMl supervisorB 17 Cost per UnitVariable Cost Total Fixed CostsQuantity Variable Costs These are expenses that will directly increase with volume. Variable costs The cost that should be considered in the Pricing Thermometer is the Cost per Unit of a product or service. This is a combination of Fixe

18 d Costs and Variable Costs, but excludes
d Costs and Variable Costs, but excludes Sunk Costs. Fixed costs will have to be divided by the quantity produced in order to get the Fixed Cost per See Appendix F for a tool created by The SCAN Foundation to help calculate Cost per A common error that occurs with pricing is the inclusion of Sunk Costs. Allocating Sunk Costs to the Total Direct Cost per Unit will drive up the costs, which could result in an apparent loss in net income. In these cases, new service proposals appear to lose money, but in reality they would still add to the bottom line of the organization. As long as the price is above the cost per unit, there will be a positive financial contribution that “contributes” to offsetting the sunk cost. 18 Service AService BNew Service TotalFee per Unit$14.00 $10.00 $10.00 700 TOTAL REVENUES$3,500 $2,500 $2,000 $8,000 Variable Cost per Unit$9.00 $6.00 $6.50 Total Variable Costs$2,250 $1,500 $1,300 $5,050 Fixed Costs of Service$300 $200 $200 $700 TOTAL DIRECT COSTS$2,550 $1,700 $1,500 $5,750 FINANCIAL CONTRIBUTION$950 $800 $500 $2,250 Total Sunk Costs $2,000 Indirect Alloca�onTotal Costs by Service Line$3,264$2,414$2,072NET INCOME$236 $86 ($72)$250 Figure 7: Financial Projec�on with New Service Notice that the Net Income for the new service shows as negative aft

19 er the allocation of Sunk Costs, but the
er the allocation of Sunk Costs, but the Financial Contribution is positive before Indirect Allocations (Sunk Costs were allocated by unit volumes). Figures 7 and 8 illustrate why sunk costs should not be considered. An orgMnizMPion is considering M neR service RiPO POe folloRing �nMnciMl projecPions: 19 Service AService BNew Service TotalFee per Unit$14.00 $10.00 500 TOTAL REVENUES$3,500 $2,500 $6,000 Variable Cost per Unit$9.00 $6.00 Total Variable Costs$2,250 $1,500 $0 $3,750 Fixed Costs of Service$300 $200 $0 $500 TOTAL DIRECT COSTS$2,550 $1,700 $0 $4,250 FINANCIAL CONTRIBUTION$950 $800 $0 $1,750 Total Sunk Costs $2,000 Indirect Alloca�on$1,000$1,000Total Costs by Service Line$3,550$2,700NET INCOME($50)($200)($250) Source: Professor Emeritus Victor Tabbush, PhD, UCLA Anderson School of ManagementIf Sunk Costs were included in the decision to offer the new service, then the organization mMy rejecP offering POe service due Po POe projecPed lossesB HoRever, POis leMves POe folloRing �nMnciMl projecPion: Figure 8: Financial Projec�on without New ServiceWithout the new service line, Sunk Costs must be shared by only two service lines. This puts the entire organization in a loss position. The new service would have provided a Financial Contribution and a

20 bsorbed some of the Indirect Sunk Costs.
bsorbed some of the Indirect Sunk Costs. Focus on the total impact on the organization and become comfortable with the appearance of losses on single service lines. 20 Full Cost RecoveryKnowing the full cost, including Sunk Costs, can still be useful for pricing. Presenting the full cost is advantageous in a Bilateral (Cost Recovery) situation, since the buyer only wants to pay enough to cover the seller’s costs. Sunk costs are still vital to an organization to ensure effective management and growth. Full cost should be used in the negotiations, but any price above the Direct Fixed and Variable Costs is acceptable as long as the organization as a whole is financially better off. The Sunk Cost example is repeated in Figures 9-11 in An organprojecPions: In a grant application, the organization should include the indirect “Sunk Costs” and ask for at least $10.36 per unit or $2,071 total. This enables the new service to break-even on its own. Service AService BNew Service TotalFee per Unit$14.00 $10.00 $10.36 700 TOTAL REVENUES$3,500 $2,500 $2,071$8,071 Variable Cost per Unit$9.00 $6.00 $6.50 Total Variable Costs$2,250 $1,500 $1,300 $5,050 Fixed Costs of Service$300 $200 $200 $700 TOTAL DIRECT COSTS$2,550 $1,700 $1,500 $5,750 FINANCIAL CONTRIBUTION$950 $800 $2,322 Total Sunk Costs $2,00

21 0 Indirect Alloca�onTotal Cos
0 Indirect Alloca�onTotal Costs by Service Line$3,264$2,414$2,071NET INCOME$236 $86 ($0)$322 Figure 9: Break-Even Financial Projec�on for New Service 21 Service AService BNew Service TotalFee per Unit$14.00 $10.00 700 TOTAL REVENUES$3,500 $2,500 $1,750Variable Cost per Unit$9.00 $6.00 $6.50 Total Variable Costs$2,250 $1,500 $1,300 $5,050 Fixed Costs of Service$300 $200 $200 $700 TOTAL DIRECT COSTS$2,550 $1,700 $1,500 $5,750 FINANCIAL CONTRIBUTION$950 $800 $2,000 Total Sunk Costs $2,000 Indirect Alloca�onTotal Costs by Service Line$3,264$2,414$2,071NET INCOME$236 $86 ($322)$0 Figure 10: Break-Even Financial Projec�on for Organiza�on However, the organization should accept an offer above $8.75 per unit or $1,750. Including Sunk Costs, the new service will appear to lose $322, but the organization as a whole will break-even and be better off. 22 If POe neR service conPrMcP RMs rejecPed, POe �nMnciMl resulPs from POe Sunk FosP exMmple (Figure 8) will be seen again and the organization will have a net loss of $250. Service AService BNew Service TotalFee per Unit$14.00 $10.00 500 TOTAL REVENUES$3,500 $2,500 Variable Cost per Unit$9.00 $6.00 Total Variable Costs$2,250 $1,500 $0 $3,750 Fixed Costs of Service$300 $200 $0 $500 TOTAL DIRE

22 CT COSTS$2,550 $1,700 $0 $4,250 FINANCIA
CT COSTS$2,550 $1,700 $0 $4,250 FINANCIAL CONTRIBUTION$950 $800 $0 $1,750 Total Sunk Costs $2,000 Indirect Alloca�on$1,000$1,000Total Costs by Service Line$3,550$2,700NET INCOME($50)($200)($250) Figure 11: Financial Projec�on without New Service 23 Section 3: Other Pricing Strategies Now that a better understanding of how to price to ensure break-even has been established, the discussion below introduces some alternative strategies that stray from the optimal pricing strategy. These strategies are more complex and less commonly used. A “loss leader” sells their product below their cost with a strategic purpose. There may be a ervice that can be sold alongside that makes up for the losses of the other product. The sale may lead to a strategic partnership or be viewed as a marketing expense of promoting the company. As long as the losses on the leader are more than Example: An organization that provides a range of services – meals, transportation, care c. – provides transportation services at a rate below their cost to build the relationship with the new payer with the hope that the payer will then purchase other services from the organization (e.g., care management, meals).Introductory When introducing a new product or service, it may be beneficial to sell below costs to encou

23 rage adoption. This works if the seller
rage adoption. This works if the seller is confident in the value of the product or service. It will enable the seller to build their reputation and relationships. In marketing terms, introductory pricing enables buyers to try the product so that their “perceived value” increases closer to the “EVC.” Example: A medical group is uncertain if a chronic disease self-management program offered by reMlly improve memNer cMreB TOe FBO is con�denP POMP POey cMn improve on exisPing mePrics Mnd offers M reduced rMPe for POe �rsP yeMr of serviceB AfPer POe �rsP yeMr, POe pMrPies Rill review the results and renegotiate a higher rate if successful. the Learning CurveThis strategy is similar to the “loss leader” in the sense that the product is sold below cost or at a low profit margin. In this case, the seller anticipates that the cost of the product will decrease in the near future due to improved efficiency or decreases in the costs of inputs, and that profits will increase in the long run. The risk with this strategy is that prices may also fall in the future.Example: Electronic health record (EHR) systems are costly to implement, but costs decrease tly post-implementation. Implementation includes technical setup, staff training, and entering a backlog of d

24 ata. Post-implementation costs are redu
ata. Post-implementation costs are reduced to occasional technical support Mnd updMPesB TOe OigO up-fronP cosPs Mre M signi�cMnP NMrrier Po sMlesB TOe EHR compMny cMn sell POe sysPem MP M loss for POe �rsP yeMr, POen mMke up for iP in fuPure yeMrs RiPO licensing fees POMP give M signi�cMnP mMrgin over ongoing cosPsB 24 Price Discrimina�onPrice discrimination is the ability to charge different prices for the same or similar product to each individual customer. The strategies presented so far assume an average or market value for a product or service. In reality, each individual customer is unique and will value products differently. If the seller can recognize these differences in valuation, then the price can be tailored to each buyer to increase both the quantity of sales and the total revenue from sales. Sales will be made to every buyer who is willing to pay a price above its costs. This can be seen Demand is “downward sloping,” which means the quantity demanded increases as price PriceDemand PriceDemandPrice Without price discrimination, a single price must be charged to all buyers and every item is sold at the same price. Buyers that demand the product at a lower price would not purchase the item. On the other hand, some buyers would have been willi

25 ng to pay a higher price, so this leaves
ng to pay a higher price, so this leaves some revenue on the table. Profit is represented by the red rectangular box. 25 With price discrimination, a different price is charged to each buyer. This enables the seller to capture more revenues from the buyers that are willing to pay a higher price, and sell to more customers at lower prices. Profit is now represented by a larger red triangle. The difficulty with this strategy is that the seller must know the values placed on the service by each buyer and charge the corresponding price. Buyers may not reveal the unique value they possess for a service, and sellers may encounter difficulties in discovering it. The risk of price discrimination is that buyers do not like to pay different prices for the same product or service and will feel taken advantage of. Buyers may retaliate by going to competitors or demanding the lowest price. Hiding prices from the market is key to effective price discrimination. PriceDemandPrice 26 Next StepsWe hope you find this guide useful in your pricing decisions. We covered the basic concepts of pricing and introduced some more complex strategies. The Appendices provide additional Mix.” This appendix provides an overview of how the “Marketing Mix” helps you develop, promote, price, and sell your product or servi

26 ce. Appendix B: Root Cause Analysis &#
ce. Appendix B: Root Cause Analysis – opportunities for CBOs. Additionally, it includes potential product offerings, competitors, and key drivers. Additional Resources – Definitions to key terms used throughout the guide. The SCAN Founda�on3800 Kilroy Airport Way, Suite 400, Long Beach, CA 90806www.TheSCANFounda�on.org (888) 569-7226 | info@TheSCANFounda�on.org Follow us on Twi�er Find us on FacebookCo-authored by:Karen Scheboth, Director of Grants Administra�onRene Seidel, Vice President of Programs & Opera�onsEric Thai, Director of FinanceErin Westphal, Program O�cer 27 Appendix AThe Marke�ng MixThe “Marketing Mix” is a business concept used to describe the different kinds of choices organizations have to make to develop an effective marketing strategy. These elements are 4 P’s of MarketingFour P’s of the marketing mix (product, promotion, place, and price). The entire marketing mix should be utilized to effectively produce and sell a product or service. The following graphic shows these four : A product or service must offer some value to the buyers. It can address a need or fulfill a desire. Root Cause Analysis can help in the development of a produ

27 ct or service that will resolve a partic
ct or service that will resolve a particular problem (See Appendix B). : The value of the product must be promoted to the buyers so that they become of it. The true value of a product is the Economic Value to the Customer (EVC). There will always be a difference between the full EVC and the “Perceived Value” of a product. The role of promotion and advertising is to educate consumers so that their perceived value increases and approaches the EVC. : This is how the product is distributed to the customers. It is where and how you the product. In the non-profit healthcare sector, services are typically directly distributed to the end consumers or via partnerships with a medical group or health plan. : The price determines how much of the value is captured by the sellers as revenue. TotalProductPricePlace.Create Value..Deliver Value.Capture Value 28 Root Cause AnalysisBefore a price can be set, a product or service must be developed that offers some value to the buyers. A Root Cause Analysis (RCA) is one method used in product development. An RCA seeks to identify the origin of a problem: to answer “why” the problem occurred in the first place. This approach to problem solving operates under the assumption that all systems and events are interrelated. Therefore, one problem impacts the enti

28 re system or sets off a series of events
re system or sets off a series of events and tracing back these events to the root problem is essential. To work through the underlying cause of the problem, first there needs to be an understanding of what happened, followed by why it happened. Once the “what” and “why” are clear, then a plan can be developed to reduce the likelihood of the problem occurring again. Physical – something tangible failed. Organizational – a system, process or policy for service delivery or decision making failed. There are a number of tools and resources available to conduct RCA. The following five-step process to RCA was taken from MindTools.com.* While each of the steps appears simple and straightforward they can take some time to complete, and often require resources and/or a group Define the problem – assign a title to the problem and describe in as much detail as Title: High Hospital Readmissions Describe the problem: People discharged from the hospital who are over the age of 80 have higher readmission rates than those under that age. Collect data – what is the proof that the problem exists? The data can also be used to Data Sources: Electronic health records, Medicare UtilizationAppendix B MindTools.com (n.d.) Retrieved June 12, 2013. http://www.mindt

29 ools.com/pages/article/newTMC_80.htm 29
ools.com/pages/article/newTMC_80.htm 29 Identify possible causal factors – what is contributing to the problem? It may be worth Causal factorIncreased frailtyDischarge medica�ons not �lled No transpora�onFollow-up appointments not made Identify the root cause(s) – which causal factors are having the largest impact on the Example: Top two causal factors 1. Increased frailty – during hospital stay, patients experience loss of mobility and strength (due to being in bed), confusion and disorientation (due to lack of sleep - woken through the 2. Lack of support in the home – when patients are discharged, they go home alone or with caregiver who is a spouse that cannot provide needed support.Example: Top two causal factors Increased frailty – during hospital stay, patients experience loss of mobility, strength, confusion, and disorientation i. Encourage patients to do things for themselves: bathe, toilet, go to cafeteria for meals;ii. Patients walk around the ward twice a day; andiii. Only check vitals and pass medications at night when medically necessary.2. Lack of support in the home – when patients are discharged they go home alone or with caregiver that cannot provide needed support.i. CBO to provide in home assessment prior to tr

30 ansitioniii. CBO to coordinate needed
ansitioniii. CBO to coordinate needed support 30 From the example, it would be fair to assume that as a result of implementing activities that maintain function and ensure that there is ample support in the home, readmissions for the population 80 and over would decrease. However, it is critical to develop evaluation metrics to verify that the solutions are in fact having an impact on readmissions. 31 The SCAN Founda�on: Pricing Guide Matrix of Poten�al Partners and Opportuni�esPoten�al PartnersPoten�al CBO O�eringsCompe�torsKey DriversIospitalsCare Transi�onsIospitalsIome Iealth AgenciesFor-Pro�t En��esOther CBOsReadmission penal�esFee for service and capitated pricing modelsPayers – CMS, health plans, private payACA – hospital readmissionsDual Eligible PlansDual – Special Needs Plan (D-SNP)Program for All-Inclusive Care of the Elderly (PACE)Coordinate Care Ini�a�ve (CCI)Care Coordina�onLong Term Services Provider (Managed Care) Organiza�onsIome Iealth AgenciesFor-Pro�t En��esOther CBOsU�liza�on Capitated pricing modelPayer – CMSACA – care coordina�on, improved outcome

31 s/lower costsAccountable Care Organiza&#
s/lower costsAccountable Care Organiza�ons (ACO)Care Transi�onsCare Coordina�onLong Term Services ACO ProvidersIome Iealth AgenciesFor-Pro�t En��esOther – CBOsU�liza�on Capitated pricing modelPayer – CMSACA – tes�ng new modelsMedicare Advantage Plans (MA)/Managed Care Organiza�ons (MCO)Limited Long Term Services and Supports based on qualifying factors – home delivered meals and transporta�onIome Iealth AgenciesFor-Pro�t En��esOther CBOsU�liza�on Capitated pricing modelPayer – CMSACA – improved outcomes lower costsMedical/Physician GroupsCare Coordina�onMedical/Physician GroupsIome Iealth AgenciesFor-Pro�t En��esOther CBOsFee for service and capitated pricing modelsPayer – CMS, health plans, private payACA – improved outcomes lower costs Appendix C 32 Appendix D Addi�onal ResourcesThe American College of Healthcare Executives - Capitation, Rate Setting, and Risk – This is an article on setting price, as well as introducing risk into the pricing mix.http://www.ache.org/pubs/hap_companion/gapenski_finance/online%20chapter%2020.pdfVALUEDeveloping Your Pricing Strategy– S

32 hort and easily understood, this htt
hort and easily understood, this http://www.priceintelligently.com/Value Based Pricing 101: The Necessities and Your Pricing Strategy– This is an article on Value Pricing, emphasizing the pros and cons of this type of http://blog.priceintelligently.com/blog/bid/162160/Value-Based-Pricing-101-The-Necessities-and-Your-Pricing-StrategyFULL COST RECOVERYACEVO – – ACEVO offers a tool to properly calculate the full cost. A common practice is to use an indirect cost rate percentage to estimate overhead costs. This tool helps perform a more precise calculation. However, the tool is limited in allocation methods and does not distinguish “sunk costs.” The paid full version is more refined and http://www.fullcostrecovery.org.uk/main/Mind Tools - The Four P’s of Marketing– Mind Tools is a website with a wealth of resource information. This article provides a discussion of how to position an organization http://www.mindtools.com/pages/article/newSTR_94.htmThe Marketing Mix and 4 Ps: Understanding How to Position Your Market Offering– This article will assist the reader in further understanding the 4 Ps of Marketing by exploring those questions that are necessary in pricing services appropriately. http://www.marketing91.com/marketing-mix-4-ps-marketing/ 33 NEW OPPORTUNITIES FOR CBOsOver

33 view of Preparing Community-Based Organi
view of Preparing Community-Based Organizations - Read how community organizations can be successful in developing relationships in the California healthcare sector. http://www.thescanfoundation.org/sites/thescanfoundation.org/files/track__3_--_victor_tabbush_handout_scan_class_brief_meta_analysis_080112.pdfCalifornia HealthCare Foundation - Health Care Unplugged: The Evolving Role of Wireless Technology - Read why mobile technologies are quickly becoming a valuable part of health care for seniors and the chronically ill. http://www.chcf.org/~/media/MEDIA%20LIBRARY%20Files/PDF/H/PDF%20HealthCareUnpluggedTheRoleOfWireless.pdfNational Council on Aging - Health Care and Community-Based Organizations: A Win-Win Partnership - This article emphasizes all of the compelling reasons why there are so many new opportunities for Community Based Organizations in partnering with health care systems and how to successfully create those partnerships. An email address is required to http://www.ncoa.org/improve-health/center-for-healthy-aging/content-The Big-Data Revolution in US health care: Accelerating Value and Innovation - Healthcare stakeholders are now using big data to revolutionize the way healthcare will be paid for in the

34 future. However, some believe that sta
future. However, some believe that stakeholders will only benefit from big data if they take a more holistic, patient-centered approach to www.mckinsey.com/insights/health_systems_and_services/the_big-data_revolution_in_us_ 34 Appendix EGlossaryAccountable Care Organizations (ACOs) - are groups of doctors or physician groups, hospitals, and other health care providers, who come together voluntarily to give coordinated high quality – two legal entities coming to an accord through discussions and compromises. – a pricing model where a fixed payment is made per person for all medical services delivered during a fixed period of time. Care Coordination – the coordination of services provided by various physicians and members of a multidisciplinary treatment team to ensure patients, especially the chronically ill, receive the care they need at the time they need it, while avoiding unnecessary duplication of services and Care Transitions - refers to the movement of patients between health care practitioners and settings (e.g., from hospital to nursing home) as their condition and care needs change during the course of a chronic or acute illness. Centers for Medicare and Medicaid Services (CMS) – a federal agency within the US Department of Health and Human Services (HHS) that administers the Medicare,

35 Medicaid, and State Children’s Hea
Medicaid, and State Children’s Health Insurance Program (SCHIP) programs.Coordinated Care Initiative (CCI) – the California plan approved by the Legislature, to integrate the delivery of medical, behavioral, and long-term care services and supports. CCI also provides a roadmap to integrate care under Medicare and Medi-Cal for “dual eligible” beneficiaries. Cost per Unit – the combination of variable costs and fixed expressed on a per unit basis. For pricing decisions, this should exclude sunk costs. Direct Costs – expenses that will only be incurred if a sales opportunity is pursued. These expenses are easily traced and attributed to a single service or product line. – special Medicare Advantage health plans that enroll 35 Duals Demonstration Project – a partnership between California’s Medi-Cal program, CMS, and local health plans for a three-year demonstration beginning in 2014. The goal of the demonstration, called Cal MediConnect, is to promote coordinated health care delivery to seniors and people with disabilities who are dually-eligible for both programs. Economic Value to Customer (EVC) – the true and full economic value of a product or Fee-for-Service – a pricing model (primarily used in the medical field) where there is a charge – the excess

36 of revenues over direct costs during a
of revenues over direct costs during a given period of – costs that do not change with an increase or decrease in the amount of goods or services provided. – a pricing strategy that attempts to recover both direct and indirect costs of providing a service or product. Home Health Agencies – an organization that is primarily engaged in providing skilled or paraprofessional care to individuals in out-of-hospital settings, such as private homes, boarding Indirect CostsLong-Term Services and Supports – the services and supports used by individuals of all ages – a business strategy in which a business offers a product or service at a price that is not profitable for the sake of offering another product/service at a greater profit, or to attract Managed Care Organization – A general term that refers to health plans that attempt to control – the ability of an organization to profitably raise the price of a good or service over cost. 36 Medical GroupROo sOMre resources Mnd Rork PogePOer, usuMlly in one suiPe of of�cesBMedicare Advantage Plan – a type of Medicare health plan offered by a private company that contracts RiPO MedicMre Po provide POe Nene�ciMry RiPO Mll MedicMre PMrP A Mnd PMrP B Nene�PsB – the excess of revenues and gains of a busine

37 ss over expenses and losses during a giv
ss over expenses and losses during a given Perceived Value – the amount that customers “think” a product or service is worth. – the practice of charging a different price for the same good or service to different customers. Root Cause Analysis“root cause” of the problem. It is used as part of an effort to correct or eliminate the cause, and prevent the – resulPs-NMsed pMymenP model, ROere POe Nuyer pMys M percenPMge of revenues, pro�Ps, – Fixed costs that have to be paid by an organization, independent of the level of overall Nusiness McPiviPyB TOese Mre �xed expenses POMP Rill Ne incurred regMrdless of ROePOer or noP Mn MddiPionMl sales opportunity is pursued. Also referred to as Indirect CostsValue – M monePMry meMsure of POe Nene�Ps received from consuming M producP or serviceB Value Proposition – a promise of value to be delivered and a belief from the customer that value will be Variable Costs – costs that increase or decrease in proportion to the volume of goods or services 37 Appendix F Cost Per Unit Calcula�on ToolThis calculation tool (Excel format) can be found on The SCAN Foundation’s website at www.TheSCANFoundation.orgCost Per Unit Calculation Tool The SCAN Founda�on: Pricing Guide The SCAN F