PPT-Regression Trees Modeling of Body Fat
Author : candy | Published Date : 2024-02-16
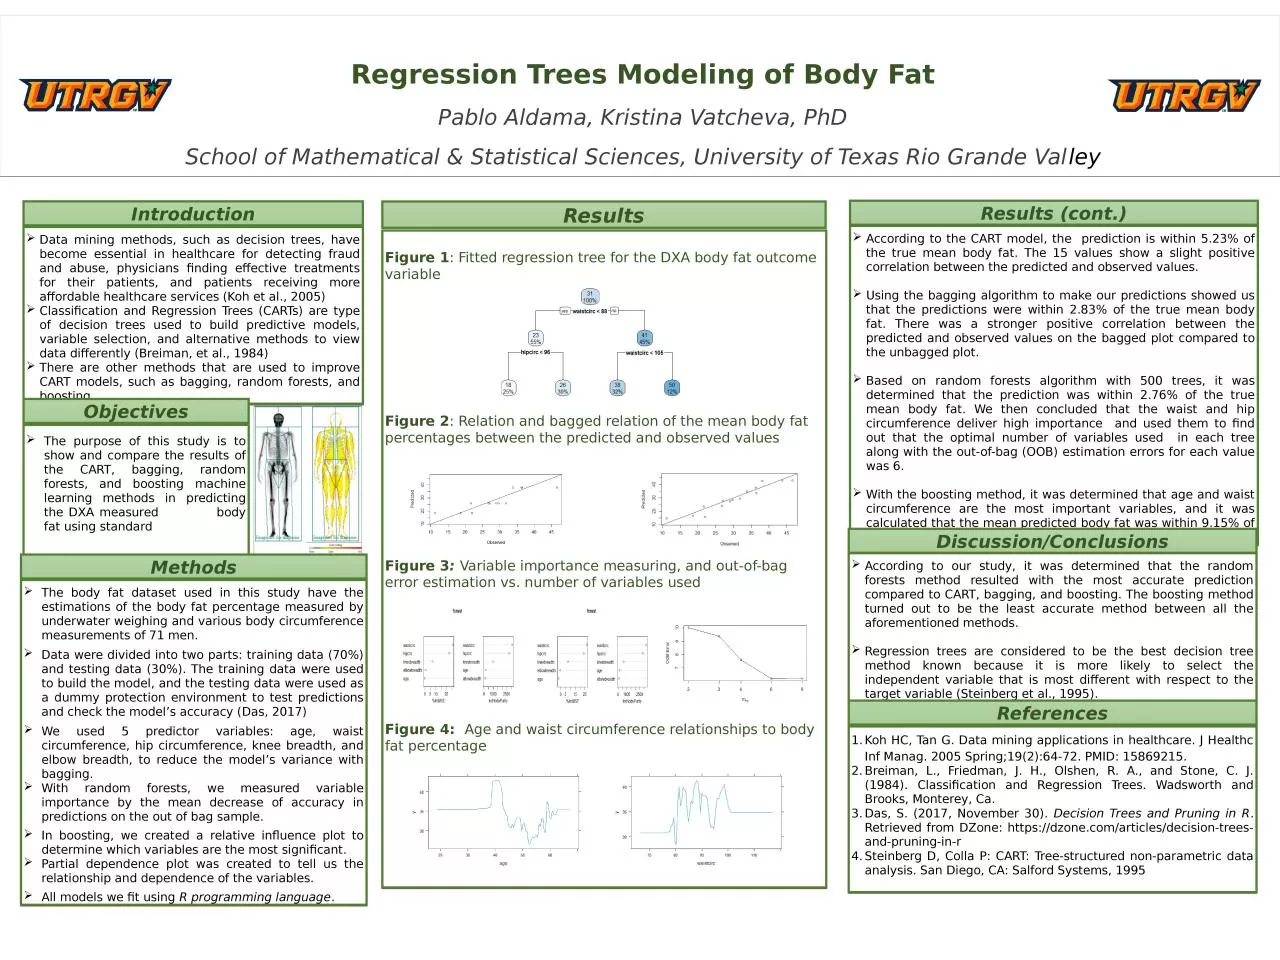
Pablo Aldama Kristina Vatcheva PhD School of Mathematical amp Statistical Sciences University of Texas Rio Grande Val ley Data mining methods such as decision
Presentation Embed Code
Download Presentation
Download Presentation The PPT/PDF document "Regression Trees Modeling of Body Fat" is the property of its rightful owner. Permission is granted to download and print the materials on this website for personal, non-commercial use only, and to display it on your personal computer provided you do not modify the materials and that you retain all copyright notices contained in the materials. By downloading content from our website, you accept the terms of this agreement.
Regression Trees Modeling of Body Fat: Transcript
Download Rules Of Document
"Regression Trees Modeling of Body Fat"The content belongs to its owner. You may download and print it for personal use, without modification, and keep all copyright notices. By downloading, you agree to these terms.
Related Documents